Going into the weekend, the question was whether Friday’s early push to the highs was real buying or a poke sellers would punish. The close answered it: sellers kept the upper hand, though they never fully finished the job.
EXECUTIVE SUMMARY
- Macro: Every longer-term gauge still points down and value has stepped lower four sessions running, yet price now sits near the bottom of a very large multi-year range.
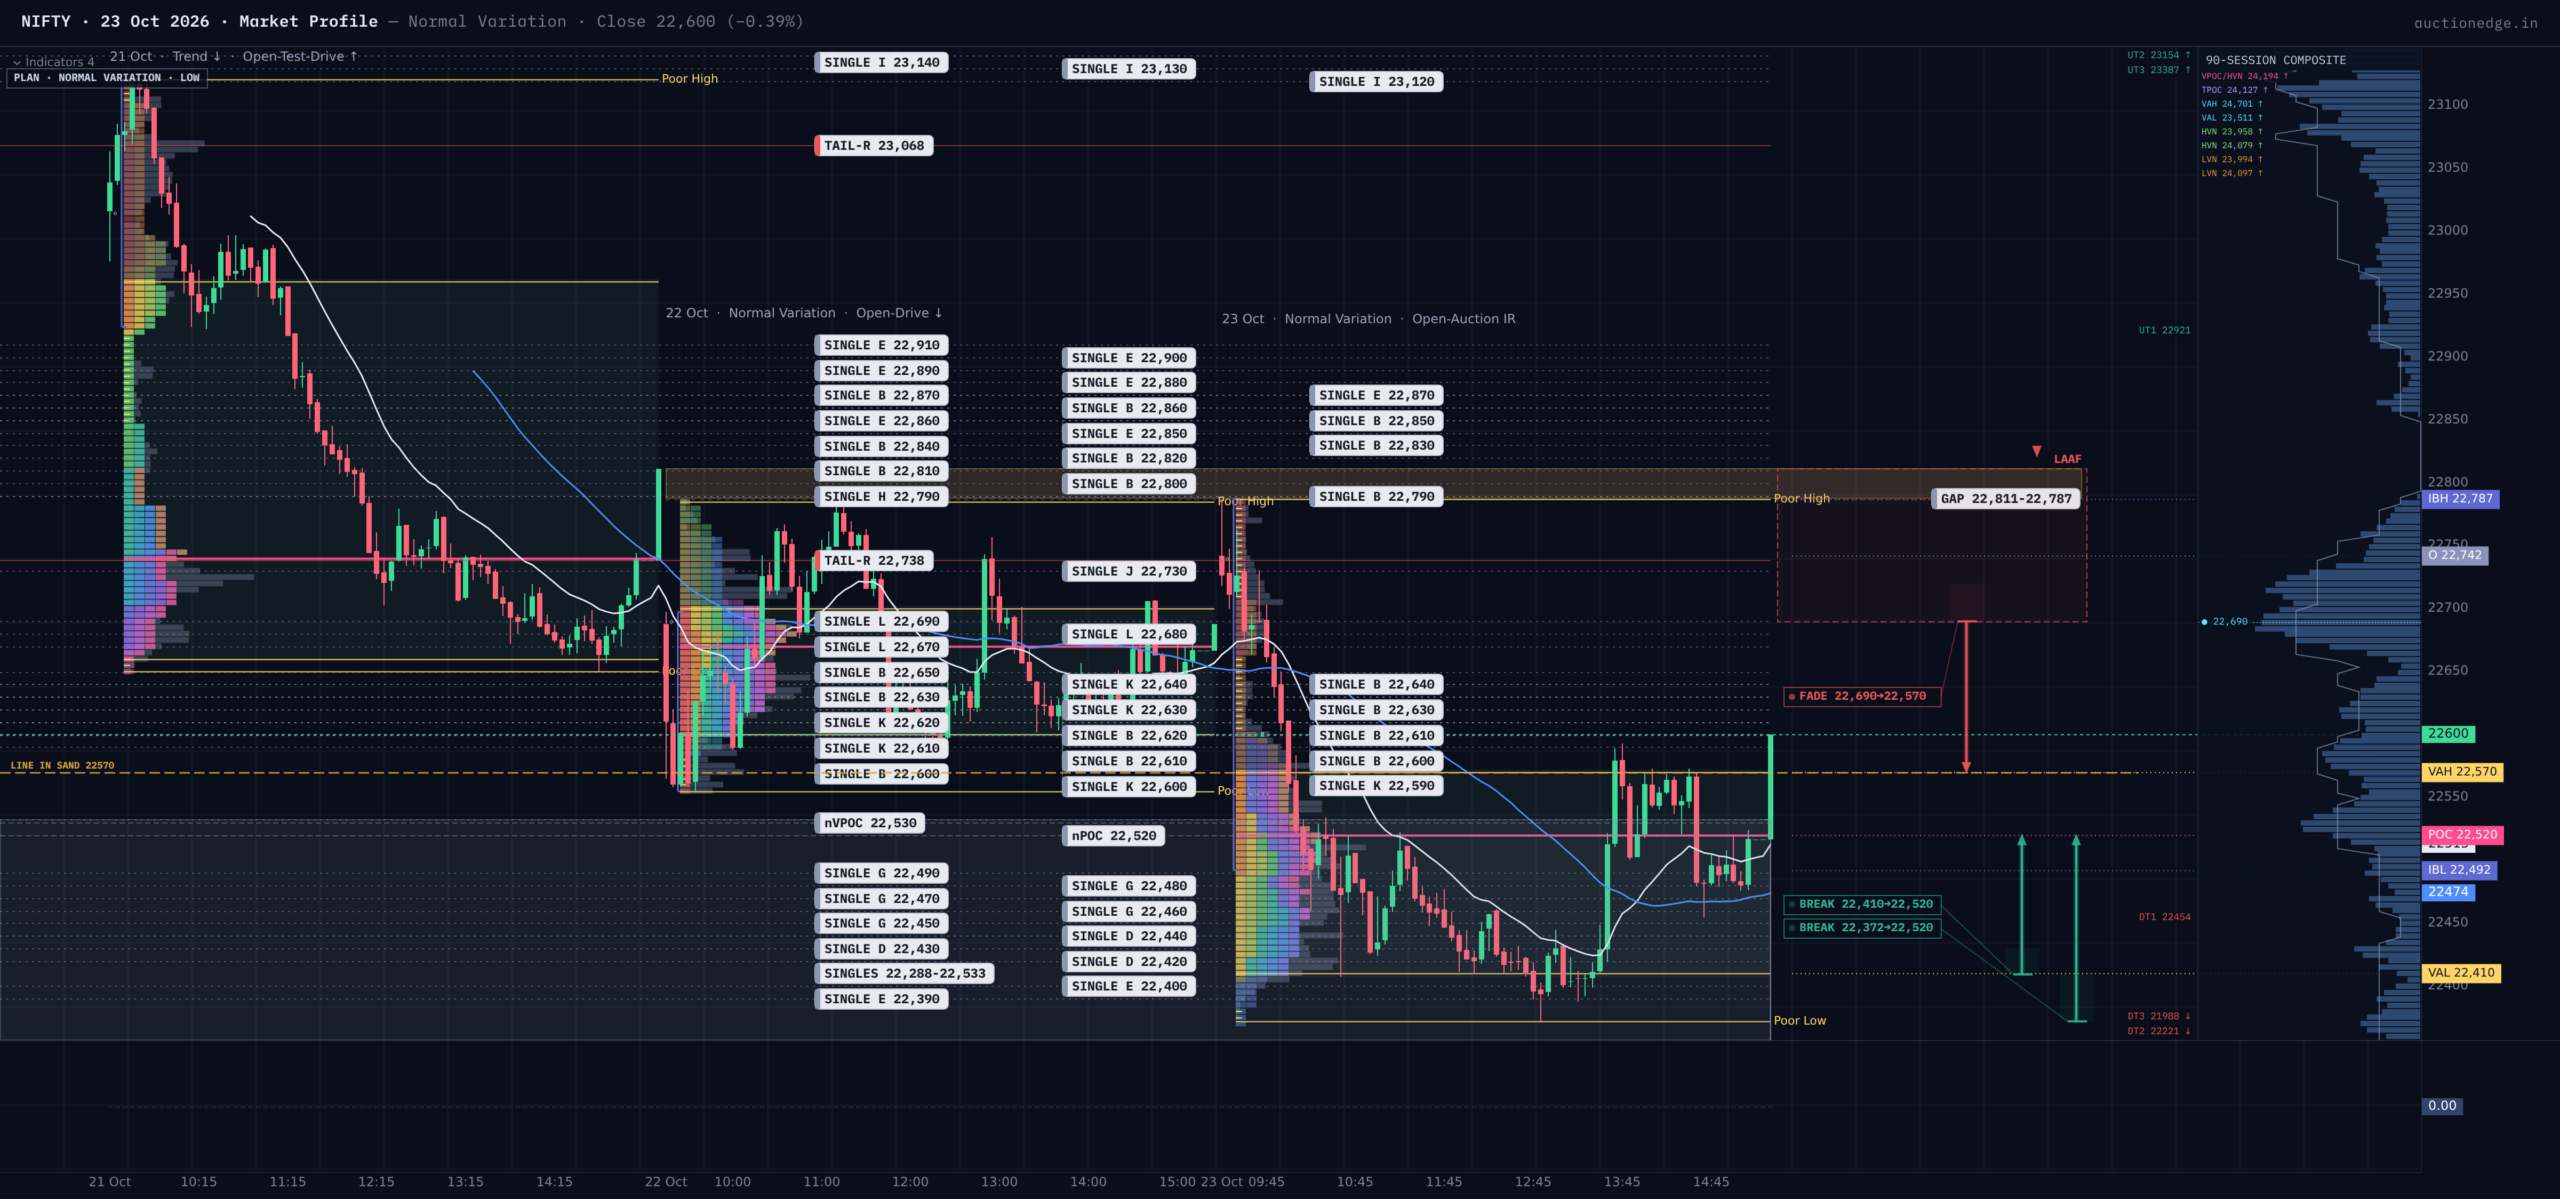
- Friday: A wide, seller-led day that spiked to 22,787 at the open, broke lower, and closed at 22,600 with value sitting entirely below Thursday’s.
- Monday: The primary read is a rotation back toward fair value near 22,520; the line in the sand is 22,570.
MACRO CONTEXT
Our composite market read is firmly bearish: the moving-average stacks, the long-run VWAPs (volume-weighted average prices) and the multi-day value areas (the zone holding about 70% of a day’s trade) all point down. Value has moved lower four sessions in a row, so Friday’s lower value was with the trend, not against it. Price sits in the lower quarter of an 842-day balance (21,744 to 26,373), where a decision is eventually forced. Closer in, the market is still inside a month-long range of 22,180 to 23,150 whose fair-value center is 22,620, almost exactly where Friday closed.
Who Controlled the Day
Friday opened with a 55-point gap up, inside Thursday’s range, which signals little conviction either way. Buyers pushed quickly to 22,787, but only the first half hour traded there, leaving a selling tail (prices sellers rejected almost immediately) from about 22,690 to the high. That rejection set the tone: the first hour’s range, the Initial Balance (IB), ran 22,492 to 22,787, a wide 295 points, and price broke below it in the very next half hour. A break that early shows longer-timeframe sellers acting with conviction rather than day traders merely poking around, and they extended to 22,372 by midday.
Value tells the migration story. Friday’s value area, 22,410 to 22,570, does not overlap Thursday’s 22,600 to 22,700 at all, and the time-based and volume-based centers agree (22,520 and 22,530), so both measures confirm the market accepted trade at lower prices. The afternoon bounce is the revealing part: buyers lifted price off the lows, yet the rally stalled at 22,600, precisely Thursday’s value low. Failing to re-enter prior value is what kept sellers in charge, and the close at 35% of the range reflects that.
The range of 415 points was well beyond Thursday’s 230 and about 1.3 times the 20-day average of 316, and the day took out both of Thursday’s extremes, so this was a Normal Variation day (a directional day with a modest range extension) that behaved like an outside day. The anchored VWAPs stack in descending order: roughly 22,588 for Friday, 22,688 for Thursday and 22,897 two days ago, so each day’s auction cleared lower than the last. Friday closed right on its own line, a sign of late balance. The week-to-date VWAP near 22,755 is the intermediate pivot above, and the opening spike failed just beyond it. The longer rolling VWAP stack is bearish backdrop only.
Volatility Cross-Check
Swings inside the day have run about twice what options imply, yet five-day realized volatility (10.1) sits below implied (14.6), so the expansion is real but not yet disorderly; the move was a modest 0.4 of a normal daily standard deviation.
Where Price Sits
Price is inside the month-long balance, so its edges (22,180 and 23,150) matter far more than the middle. Only a break of 22,180 would unlock the pre-computed extension toward 20,240.
Zones That Matter Monday
Three reference levels carry the plan. First, the selling tail at 22,690 to 22,787 stacks on Thursday’s value high (22,700) and Thursday’s VWAP (about 22,688), the first real test for any rally. Second, today’s high-volume centers at 22,520 and 22,530 sit 70 to 80 points below the close and tend to pull price back like a magnet. Third, the buying tail (prices buyers rejected quickly) at 22,288 to 22,372 from last week is only partly filled; Friday’s low just touched its top edge.
What History Says
The statistical picture is weak: the best cue, a Friday after a Normal Variation day, shows 51% up versus 35% down over 84 cases, an edge too small to lean on. Fifty similar days split 52% up, 38% down and 10% flat, with an average next-day range near 199 points. History offers no decisive edge here.
Game Plan / Bottom Line
Expect Monday to be decided by whether the market can re-enter Thursday’s value or instead returns to Friday’s. If it opens inside Friday’s value (22,410 to 22,570), favor responsive trade toward the 22,520 center and fade the edges. If it opens between 22,570 and 22,787, the 22,690 area is a natural place for sellers to defend. A gap below 22,372 invites initiative selling toward the 22,288 tail, but expect responsive buyers there. A gap above 22,787 carries a trap warning: it runs straight into the selling tail and the 23,016 to 23,121 rejection zone beyond, so a failure back under 22,787 is the fade.
Line in the Sand & Key Levels
LINE IN THE SAND: 22,570. Above it and holding, the bias eases toward a recovery into Thursday’s value; below it, Friday’s lower value stays intact and sellers keep control.
KEY LEVELS (high to low):
– 23,016 to 23,121 | Selling tail | Prior rejection zone above.
– 22,787 | Day high | The gap-up fade trigger.
– 22,690 to 22,700 | Selling tail base and Thursday’s value high | Confluence where sellers should defend.
– 22,600 | Thursday’s value low | The level the bounce could not reclaim.
– 22,570 | Friday’s value high | Line in the sand.
– 22,520 to 22,530 | Friday’s centers | Magnet for rotation.
– 22,410 | Friday’s value low | Floor for responsive buyers.
– 22,372 | Day low | Breaking it opens the 22,288 tail.
Session Learning Note
When the opening spike is capped by a tail and the first range is unusually wide, that spike tends to hold as the high of the day. The prior day’s value edge is the real test of acceptance.