Friday’s close at the highs asked a simple question: would buyers defend that level on Monday, or had they run out of fuel? By the close, the answer was clear. Sellers took the day, and they took it from the first minutes.
EXECUTIVE SUMMARY
- Macro: price sits in the middle of a three-week balance, below its longer-term averages, so rallies still meet overhead supply.
- Session verdict: a Normal Variation down day (directional, with a modest range extension) that opened at Friday’s highs and closed on its lows.
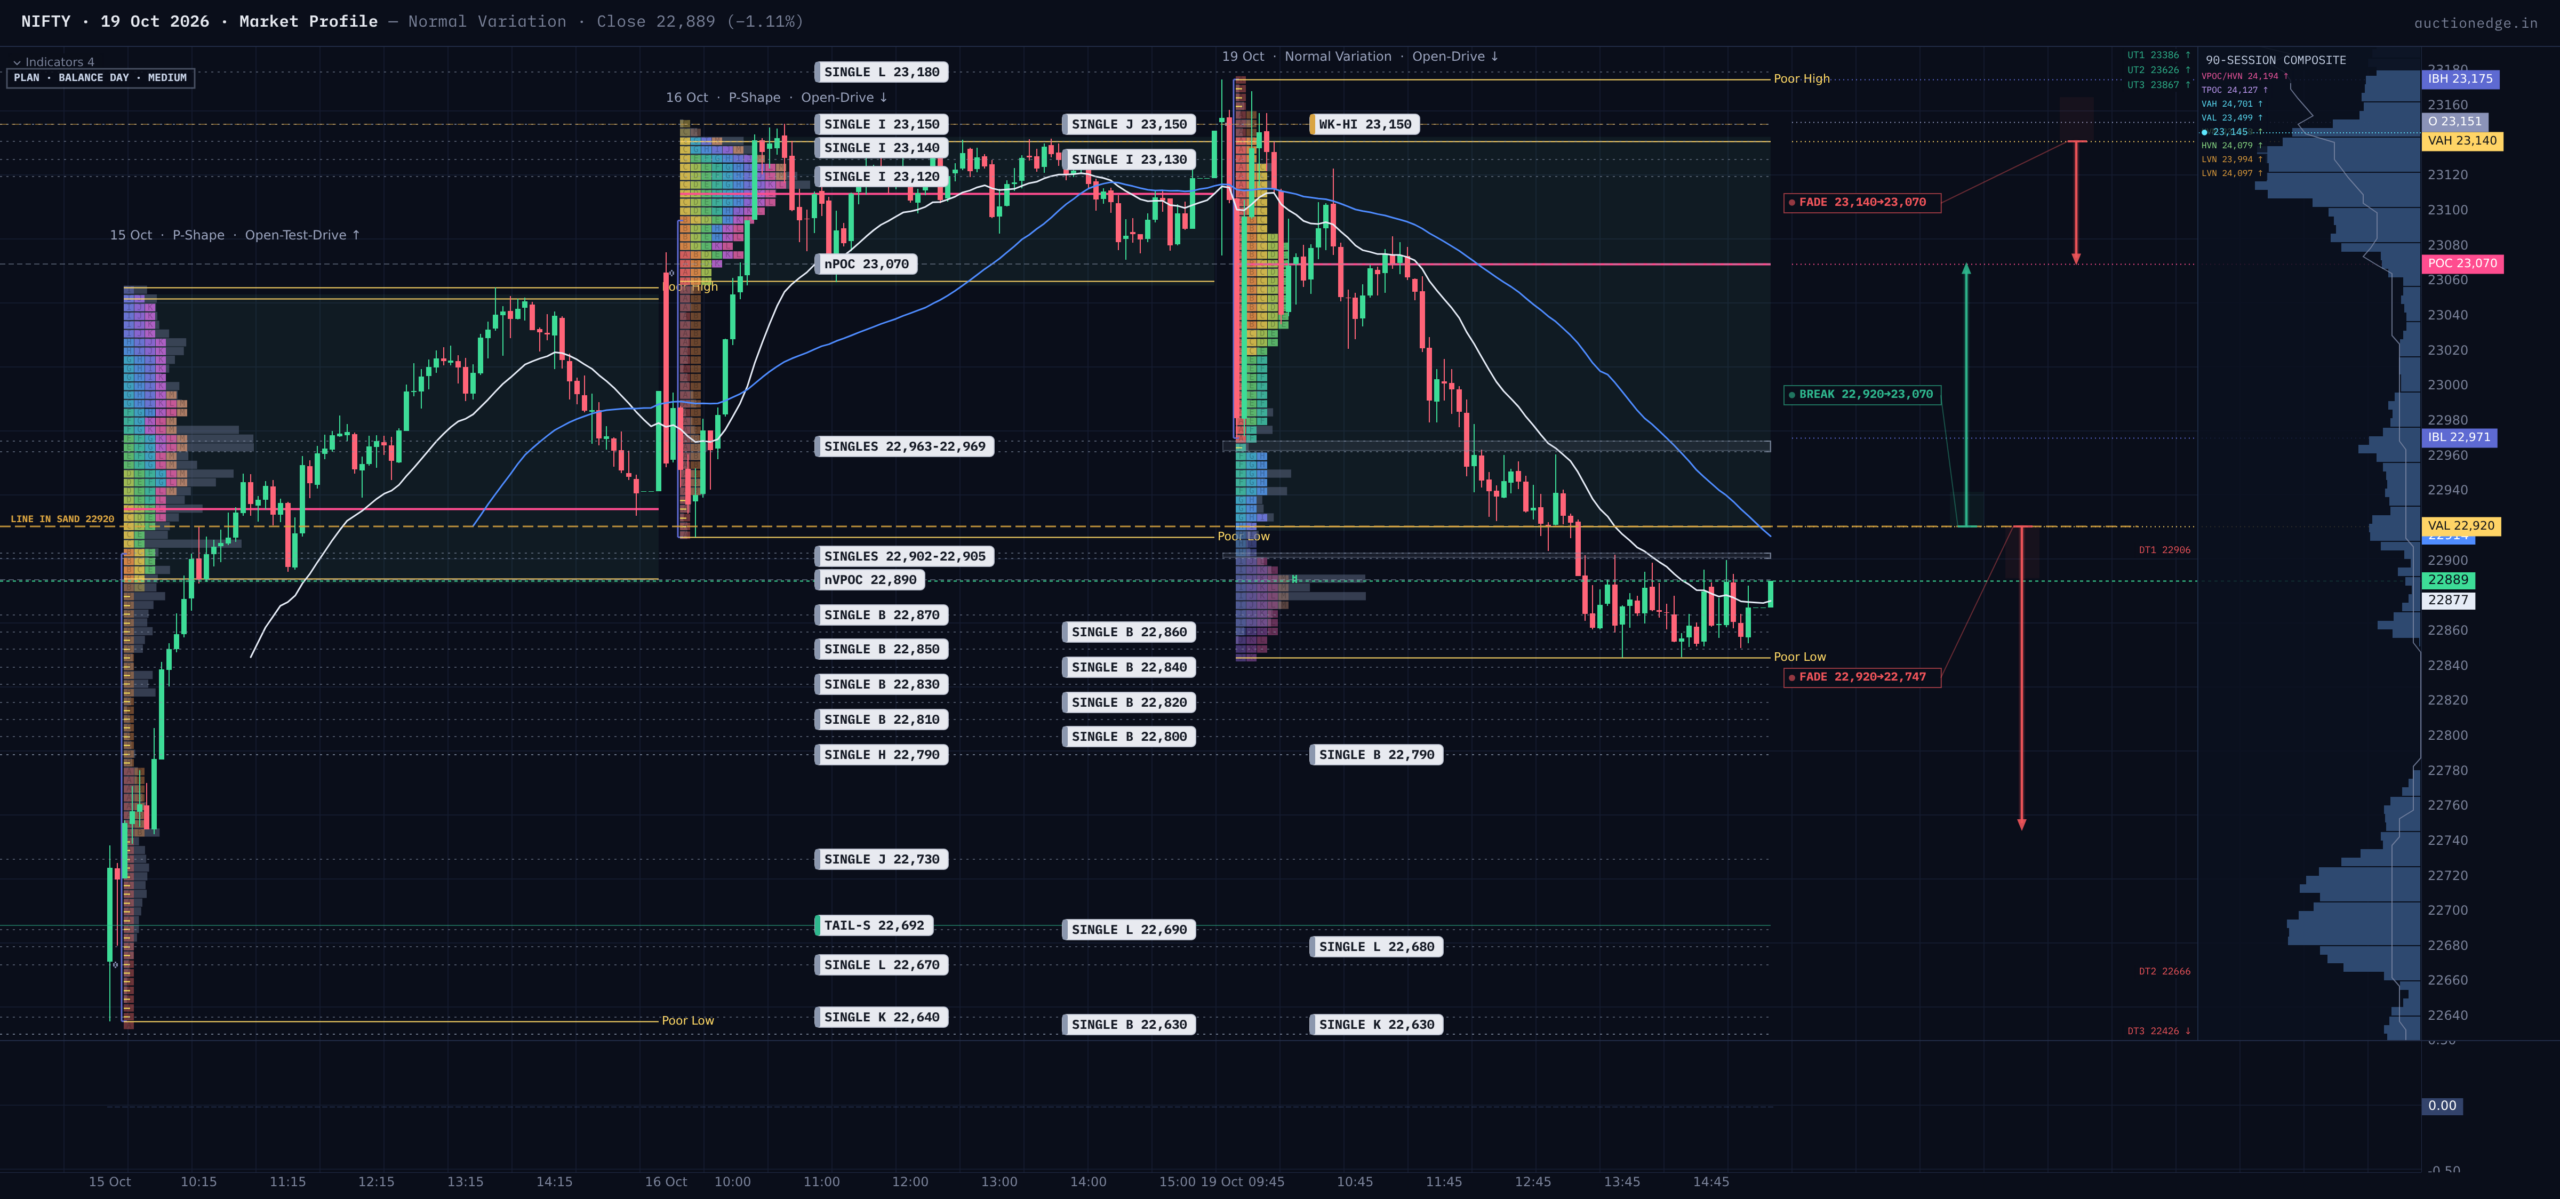
- Today’s plan: the line in the sand is 22,920; accepted above it we rotate toward 23,070, held below it the path points to 22,747.
MACRO CONTEXT
Our composite market read leans mildly bearish: price is under its 50- and 200-day averages and the 50-day sits below the 200-day (a “death cross”). Last week still pushed the market from 22,288 to 23,146, so the short-term picture is a bounce inside a bigger downtrend. The market is sitting in the lower quarter of its two-year balance, and inside a 19-day trading range between roughly 22,180 and 23,150. Monday began by testing the top of that range, and it failed. Friday’s rally was therefore with the short-term trend, but Monday’s reversal was against it, which says the bounce is tiring.
Who Controlled the Day
Nifty opened at 23,151, a 5-point gap above Friday’s close, and drove straight lower. The opening-range high at 23,175 was the day’s high, and a small selling tail (a short spike buyers could not hold) marked it. Think of the open as a test: buyers tried to extend Friday’s strength, found no new business above 23,150, and sellers took over.
The first hour built a 205-point Initial Balance (the first hour’s range). It broke down only in the late-morning session, not in the first two hours. A late break signals hesitant, rather than urgent, selling, and the extension to 22,845 added just 125 points beyond the Initial Balance. That is well short of doubling it, so control was real but not decisive. The result is a classic Normal Variation: one side wins, but the range never turns into a runaway trend.
Value tells the same story from a different angle. The value area (the zone holding about 70% of the day’s trade) ran from 22,920 to 23,140 and overlapped Friday’s, but its centre slipped from 23,110 to 23,070. Value did not migrate cleanly; instead, trade moved down within the old area and then closed outside it, at 22,889. A close under value is acceptance of lower prices, and 22,920 is where tomorrow’s argument starts.
Where the Volume Sat
The most traded price was 22,890, almost exactly where we closed, while the place the market lingered longest in time was 23,070. That is a 180-point gap between time and volume. In plain terms, the morning spent time up high, but the afternoon traded the real size down low, and the close sat on the heaviest-volume price. Sellers were not rejected at the lows; the lows were accepted. The bottom is also a “poor low” (an unfinished-looking floor with no rejection spike), and such floors tend to be revisited. The close landed in the bottom 13% of the day’s range, a strong-low finish.
Anchored VWAPs and Backdrop
Today’s volume-weighted average price was 22,991, and the week-to-date anchor is the same level, so 22,991 is the pivot buyers must reclaim. Today’s average sits below Friday’s (23,078) but above Thursday’s (22,940), a mixed, transitional ordering rather than a clean trend, and the three are not coiled. The longer rolling averages are mixed and mostly above price.
Volatility, Balance and Zones
Options remain rich relative to realized movement and the day’s range ran about 1.2 times the typical daily range, so standard levels are less reliable; widen stops and targets by about 30%. Today’s push above the top of the 19-day balance by 25 points, followed by a close 260 points lower, is a failed upside probe (“look above and fail”). Such failures often travel back toward the opposite side of the range; the first stop on that route is the buying tail at 22,637 to 22,747, left behind by Thursday. Overhead, two thin single-print areas (22,902 to 22,905 and 22,963 to 22,969) offer only minor resistance, while the real supply is the old selling tail and downside gap at 23,222 to 23,350, where Tuesday’s gap-up risks a trap.
What History Says
After similar days (a Normal Variation with a weak close, 70 cases), the next day closed higher 53% of the time against 41% lower. This is a slight lean at best, not an edge, so we do not lean on it.
Game Plan
The primary expectation is a two-way session built around 22,920. If the market opens inside value and holds two half-hour periods back inside it, rotation toward 23,070 is the base case. If it opens below value and cannot reclaim 22,920, expect another probe of the poor low and then 22,747. Gaps in either direction run into the zones above and below, so expect the first reaction there.
Line in the Sand & Key Levels
LINE IN THE SAND: 22,920. Above 22,920 with acceptance, the bias is a rotation to 23,070. Below it, the bias is lower toward 22,747.
– 23,222 to 23,282 | selling tail and gap supply | overhead trap zone for a gap up
– 23,175 | day high | failed upside probe
– 23,140 | value area high | rotation ceiling
– 23,070 | time-based point of control | rotation target
– 22,991 | anchored VWAP | key pivot
– 22,920 | value area low | line in the sand
– 22,890 | volume point of control | where the close sat
– 22,845 | day low and poor low | likely revisited
– 22,747 to 22,637 | buying tail | first real support
Session Learning Note
A late Initial Balance break plus a modest extension produces a directional day without a trend; the real information was the failed probe above the balance top, not the day label.