The question for Wednesday was whether a 127-point gap up would be accepted or sold into. Sellers answered within the first two hours, though a late bounce leaves the final verdict less tidy than the headline suggests.
EXECUTIVE SUMMARY
- The bigger picture remains bearish: price sits in the lower quarter of its long-term range, beneath its key longer-term averages, even though last week’s fair-price zone crept higher.
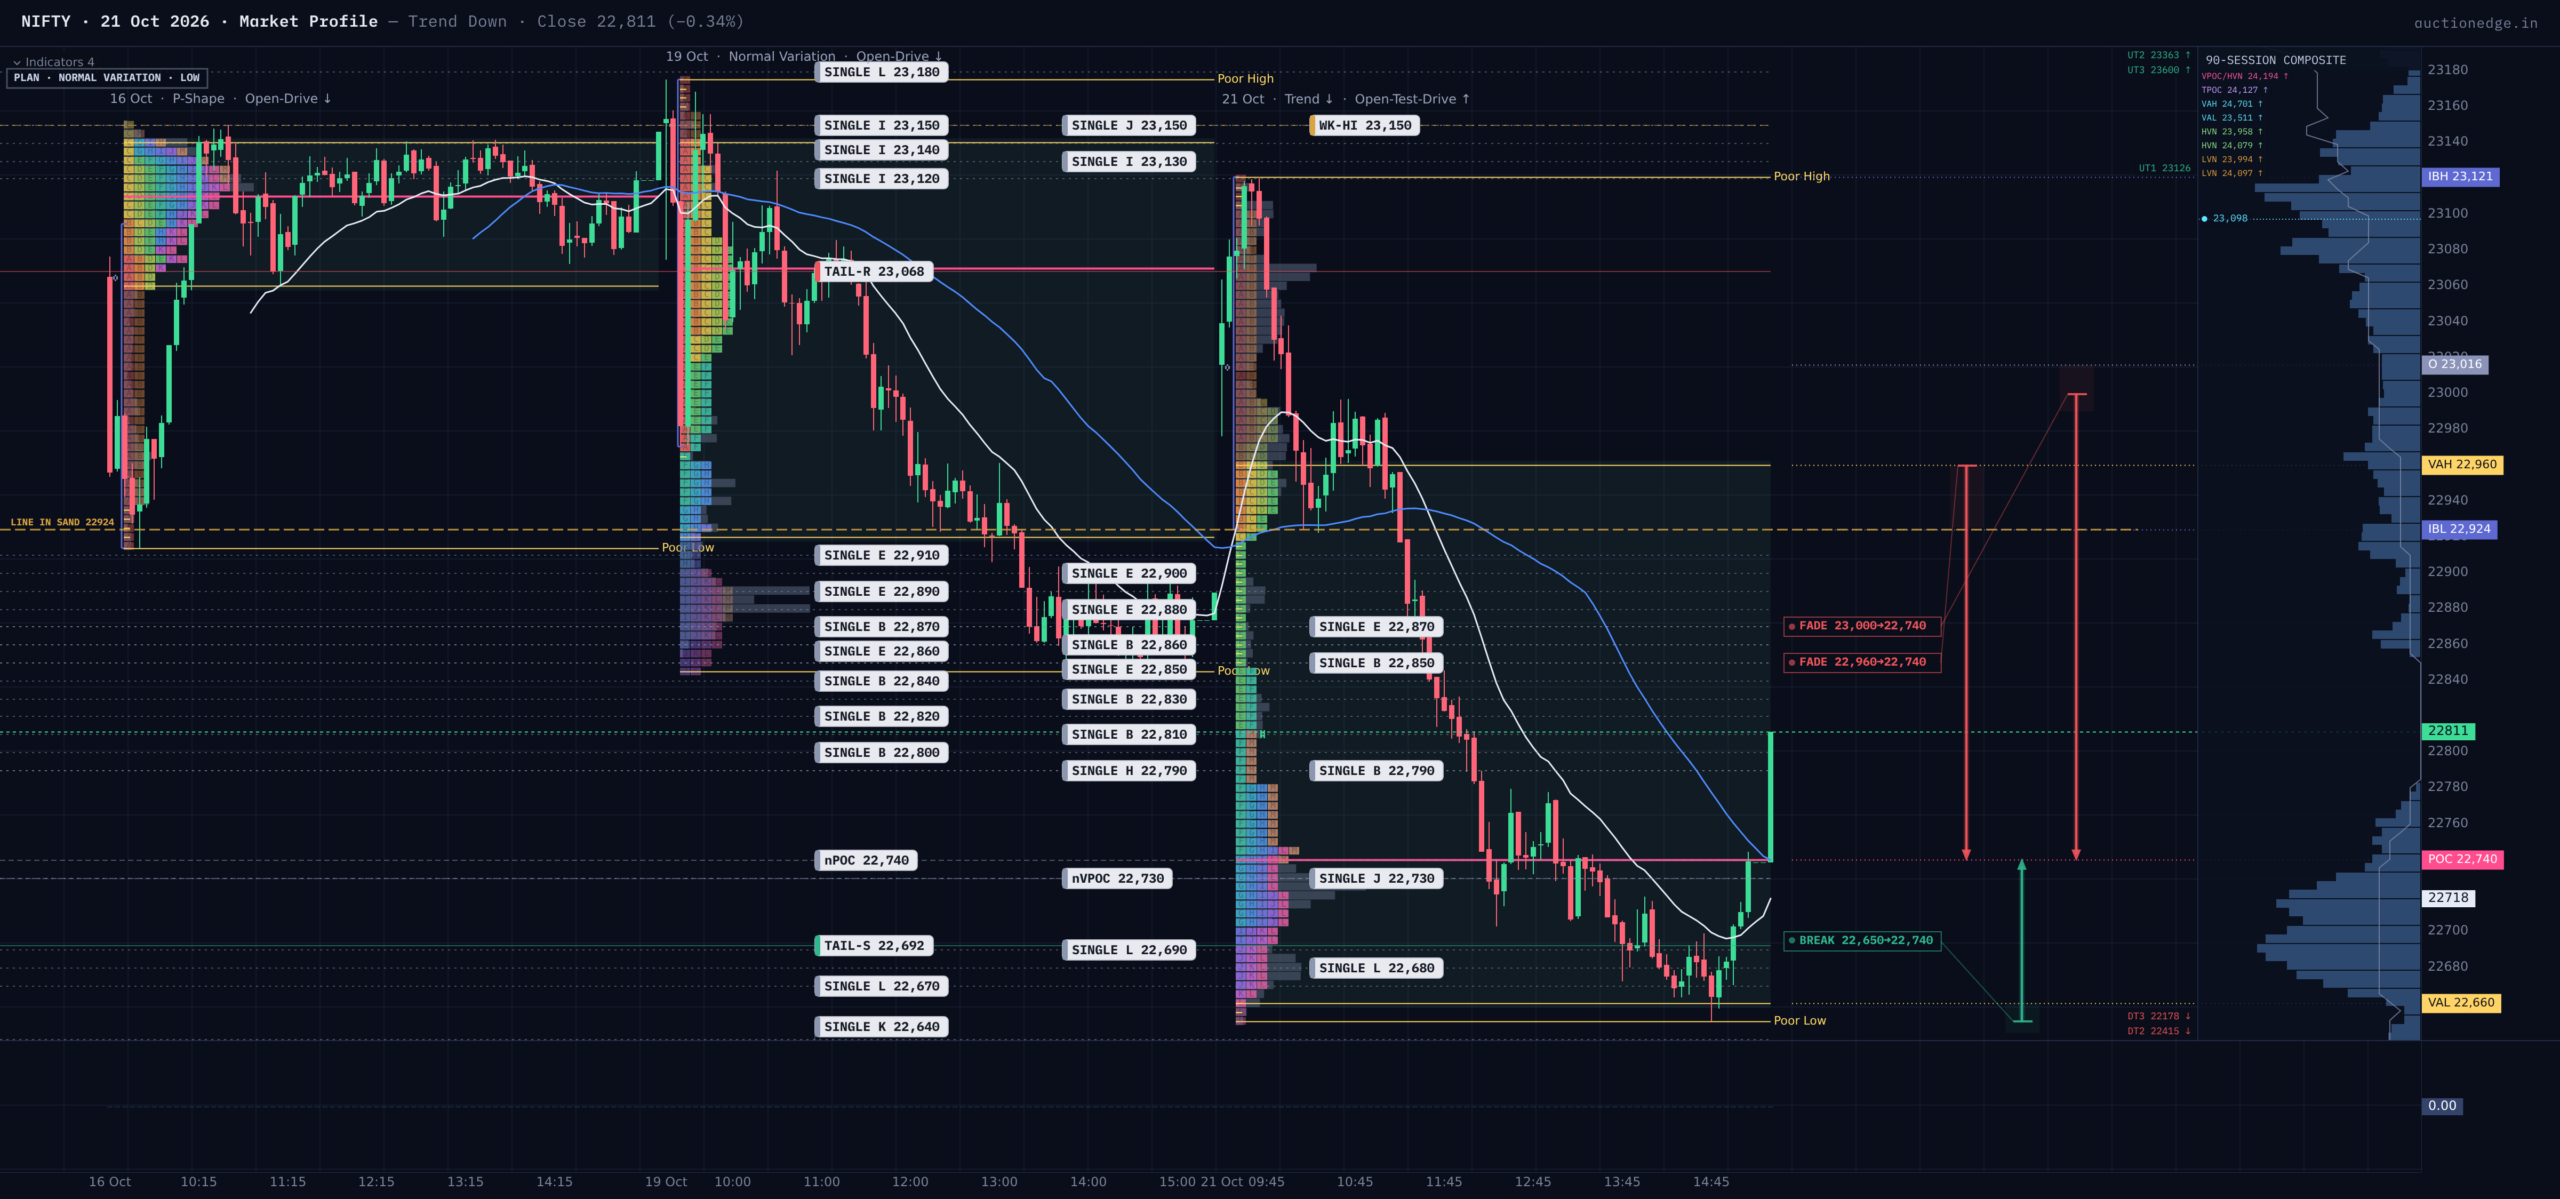
- Wednesday was a trend-down day: an upside test failed at the open, the first hour’s range broke early, and the fair-price zone moved decisively lower before a late bounce.
- Tomorrow’s primary scenario is rotation inside 22660–22960 with a downside lean. The line in the sand is 22924; 22650 decides whether selling continues.
MACRO CONTEXT
Our composite market read stays bearish, with a death cross (the 50-day average below the 200-day) and every rolling VWAP stacked in descending order. Price sits in the lower quarter of an 839-day balance range, testing the zone where longer-term buyers have previously stepped in. Last week’s rally to 23146 now looks like a swing inside a larger downtrend: the two sessions since have handed back most of it, so the session worked with the trend rather than against it.
Who Controlled the Day
The open was an open-test-drive (a probe in one direction, then a sharp reversal): the market pushed to 23121 right at the start, found no new buyers, and left a selling tail (prices buyers rejected quickly on the way back down) about 105 points deep. Sellers then broke the Initial Balance (the first hour’s range) in the third half-hour. An early break signals conviction from larger, longer-horizon sellers, and every following half-hour printed lower, the footprint of one side in control.
The value area (the zone holding about 70% of the day’s trade), 22660–22960, sits almost entirely beneath the prior session’s 22920–23140. That near-total lack of overlap confirms value migrated lower, not merely that price dipped. The range of 471 points ran about 1.6 times the typical daily swing, so sellers were not just present, they were efficient.
The close complicates the story. Price bounced roughly 130 points over the final 45 minutes and finished at 22811, above the point of control (the day’s most-traded price, 22740) and back inside value. A true trend close sits at the low; this one shows responsive buyers defending the 22650 area, so the selling lacked a clean finish.
Anchored VWAPs frame it clearly: today’s 22897 sits below yesterday’s 22991, which sits below the day before’s 23078, a descending stack of auctions. The weekly VWAP at 22936 is the intermediate pivot overhead, and the close sits below all of them. Volatility is a cross-check only: options at about 14 are fairly priced against realized movement near 17, and intraday swings match what options imply, so standard levels should hold.
Reference Zones
The market closed below the prior two-session balance floor of 22845; a sustained break would put the pre-computed measured-move targets near 22185 and 21854. Three zones matter tomorrow. Below, the buying tail from today (22650–22739) overlaps a partly filled one at 22637–22650, a stacked confluence of responsive interest. Above, today’s selling tail (23016–23121) is the first barrier, with the heaviest call open interest at 23000 adding weight (positioning is descriptive, not predictive). Higher still, an unfilled gap and selling tail at 23222–23350 are overhead supply for any gap-up attempt. Historical analogs show no decisive edge: next-day outcomes lean slightly lower (55%, only 11 cases).
Game Plan
Primary (about 45%): price opens inside value, rotates between 22660 and 22960, and fails to reclaim the first-hour low, with a mild downside lean. Alternate (about 30%): sellers push below 22650 and test the lower buying tails. Alternate (about 25%): buyers reclaim 22924 and pull back toward 22960–23016. Everything beyond that is If/Then, not a forecast.
Opening Playbook
- Inside value (22660–22960): responsive. Fade moves into 22925–22960 toward 22740; stop above 23000.
- Below value, inside range (22650–22660): buy the confluence of tails at 22637–22660, targeting 22740; stop below 22630.
- Above value, inside range (22960–23121): fade 22990–23016 toward 22740; stop above 23065. Weekly VWAP and the selling tail line up here.
- Below range (under 22650): a break that accepts (two half-hours holding below) targets 22520, a naked POC (an untested prior high-volume price). Trap Warning: stacked buying tails below make this a poor chase; stop back above 22700.
- Above range (over 23121): a gap up into 23222–23350 is a Trap Warning: fade rejection at 23125–23170 toward 22960; invalidation above 23222.
Line in the Sand & Key Levels
LINE IN THE SAND: 22924. Above it, the selloff is being repaired and bias turns neutral. Below it, sellers keep control.
- 23222–23350 | Gap and selling tail | overhead supply
- 23121 | Day high | start of today’s selling tail
- 22960 | VAH | upper edge of value
- 22924 | First-hour low | line in the sand, near VWAPs
- 22740 | POC | untested magnet and pivot
- 22650 | Day low | buying tail floor
Session Learning Note
An early break plus a late bounce means a trend day can end without a trend close; read the final hour to judge whether sellers can carry the next open.