Thursday asked a simple question: after Wednesday’s brutal selloff, would buyers show up at the gap-down open, or would sellers simply keep pushing? The market answered “both, in sequence” — sellers took the open, buyers took the morning, and then nobody wanted to commit.
EXECUTIVE SUMMARY
- The backdrop is firmly bearish: every major trend gauge points down, though the market sits in the lower part of a very large multi-year range.
- Wednesday was a one-way trend-down day; Thursday opened 124 points lower, drove to a fresh low, then recovered into a Normal Variation day (a directional day with a modest range extension) that closed back near its open.
- Tomorrow’s primary scenario is rotation around 22,700; acceptance above it opens a path toward 22,830, while a return below 22,600 hands control back to sellers.
MACRO CONTEXT
The broader picture remains a downtrend. The stack of trend measures (moving averages, VWAPs and a 50/200-day death cross) is aligned bearish, and the last four sessions of fair-value migration were lower, lower, lower, then a small step higher. Price is parked at roughly the 20% mark of an 842-day balance, the lower quarter of a long-term range, where larger participants have historically been willing to test. Wednesday’s heavy selling was therefore with the trend, while Thursday’s recovery was against it but unconvincing.
Who Controlled the Day
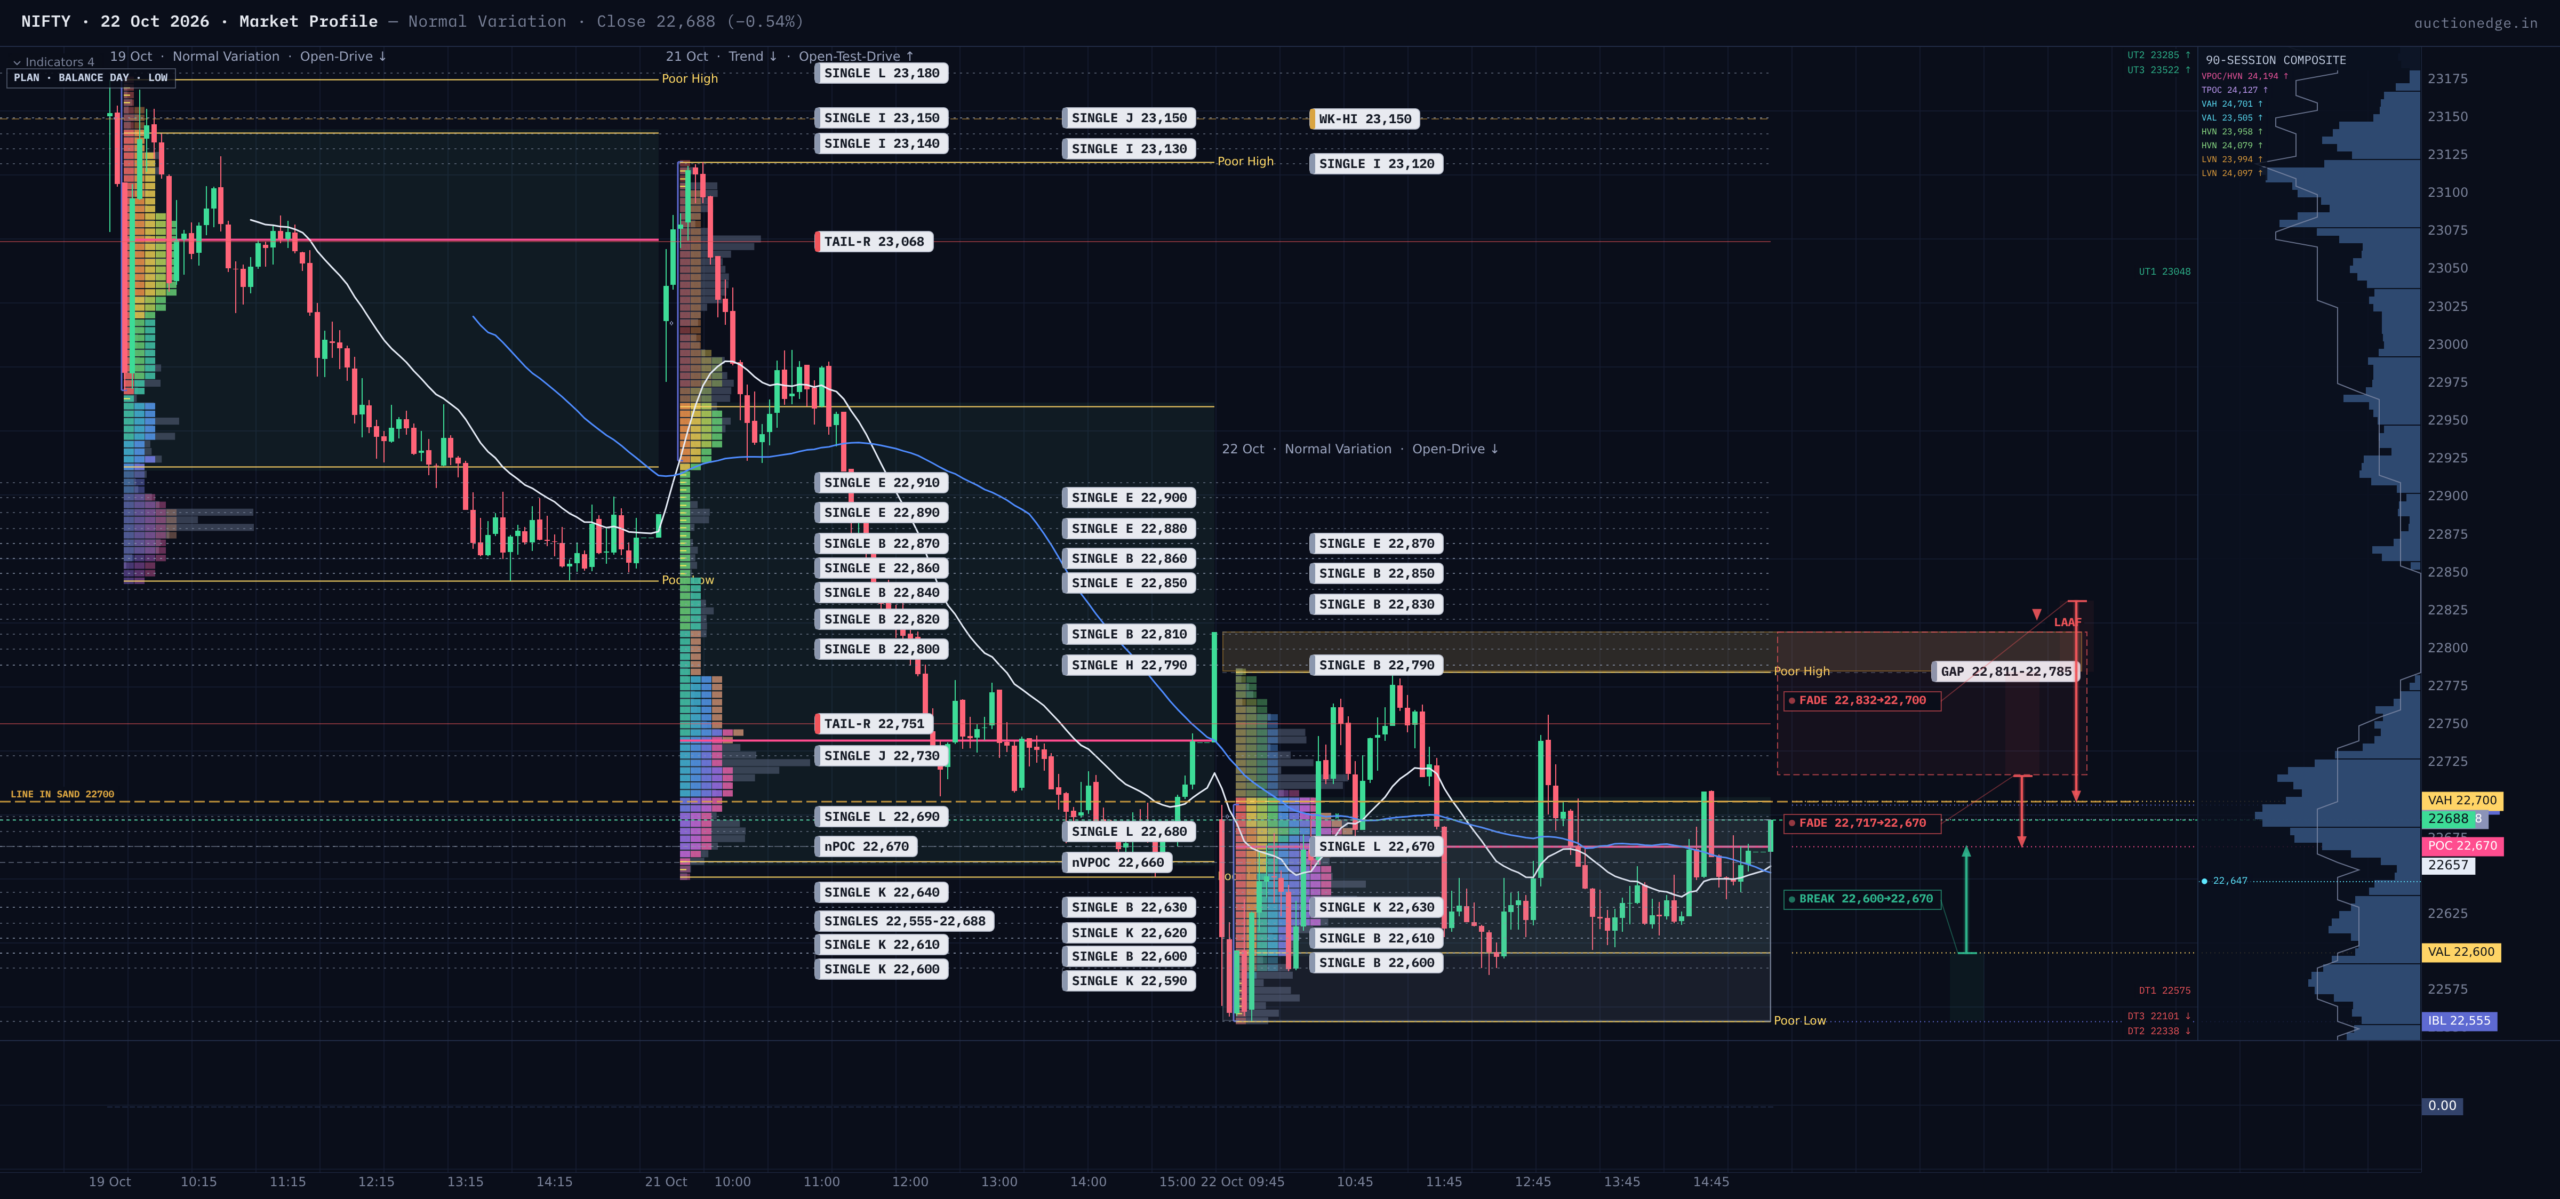
Thursday opened with a gap down and an open-drive (an immediate, one-directional push from the opening bell). Sellers drove straight to the low of 22,555 in the first hour, and that low was never revisited. That is the footprint of a motivated seller; the failure came afterwards. Buyers stepped in around the low, leaving a roughly 30-point buying tail (prices sellers pushed to and the market rejected quickly), then pressed through the first hour’s range (the Initial Balance) in the early morning, which is the kind of early break that normally signals real conviction.
Conviction faded fast, though. The upside extension stalled at 22,785, and the market spent the afternoon rotating back down into the middle of its own range, closing at 22,688 — essentially where it opened, and within a point of the day’s VWAP. Prices above 22,717 were rejected, forming a selling tail that now sits overhead. Buyers proved the low was defensible; sellers proved the high was not. That is a two-sided auction, not a trend.
Value tells the same story with a different emphasis. Fair value (the zone holding about 70% of the day’s trade) formed between 22,600 and 22,700 with the peak-activity price at 22,670, below Wednesday’s zone but overlapping its lower edge. Value is still migrating lower, just slowly, and the close inside value says the market accepted these prices rather than rejecting them. Volume and time agreed: the most-traded prices sat only 10 points apart.
The Anchored VWAPs
Today’s VWAP is below yesterday’s, which is below the day before, a falling staircase that confirms sellers still own the multi-day auction. The weekly VWAP at 22,832 is the key intermediate pivot overhead: bulls need acceptance above it to change the story. The VWAPs are not compressed, so no imminent expansion signal there.
Volatility, Balance and Zones
Today’s 230-point range was narrower than the recent average and well inside the 302-point average daily range, yet intraday swings are running about 64% larger than options imply, so don’t assume quiet tape. Price remains inside a 19-day balance (22,180 to 23,150), roughly a quarter of the way up from its floor; no boundary was broken today. The zones that matter tomorrow: the selling tail at 22,717 to 22,785 overhead, today’s buying tail near the low, and an untested prior-day peak-volume price at 22,520 below.
Historical Statistics
Historically, similar days (Normal Variation after a down-drive open, 164 cases) were followed by higher prices 52% of the time versus 38% lower. That is only a slight lean toward the upside, and the edge is too small to lean on by itself.
Opening Playbook
- Inside value (22,600 to 22,700): expect rotation. Respond at the edges, don’t chase the middle; wait for the first hour to show direction.
- Below value, inside range (22,555 to 22,600): responsive buyers defended this area today. Look for a hold above the low with a target at the 22,670 peak-activity price; failure back below 22,555 ends the idea.
- Above value, inside range (22,700 to 22,785): the selling tail starts at 22,717. Trap warning for buyers here: rejected prices tend to be rejected again. Fade toward 22,670 unless value is accepted higher.
- Below range (under 22,555): a break of the open-drive low would be a new initiative move for sellers; the first target is the untested 22,520 level. A quick return into value means the break was a trap.
- Above range (over 22,785): trap warning; a gap up runs straight into the 22,832 cluster (weekly VWAP and the balance’s upper value edge). Expect sellers to test it, with invalidation if price accepts above Wednesday’s average of 22,897.
Line in the Sand
Above 22,700, buyers have taken back the first-hour high and the bias is toward 22,832. Below 22,600, sellers have rejected today’s recovery and the downtrend resumes.
Key levels:
– 22,832 | weekly VWAP and balance upper value edge | the main overhead cluster
– 22,785 | day high | top of the selling tail
– 22,700 | value top and first-hour high | the line in the sand
– 22,670 | day’s peak-activity price | fair-value anchor
– 22,600 | value bottom | where sellers reassert
– 22,555 | day low | open-drive low, buying tail base
– 22,520 | untested prior peak-volume price | first downside magnet
Game Plan / Bottom Line
The most likely outcome is another rotational session around 22,670 to 22,700, with the trend still tilted down but without fresh conviction from either side. The best trades are responsive: fade the tails at both ends of the range rather than chasing the middle. A decisive move needs a clear break of 22,555 or acceptance above 22,700; until then, hedge, size modestly and let the edges do the work.
Session Learning Note
A strong open-drive that fails to extend into a trend tells you the sellers’ energy was spent in the first hour, which usually means a rotation rather than a reversal; expect the next day to test whether that energy returns.