The question into Friday was whether the gap below Thursday’s value marked fresh sellers or only a pause in a powerful two-week advance. The answer was a stalemate, struck at lower prices.
EXECUTIVE SUMMARY
- Two straight weeks of one-directional upside and a bullish moving-average backdrop keep the bigger picture constructive, even as the daily auction cools.
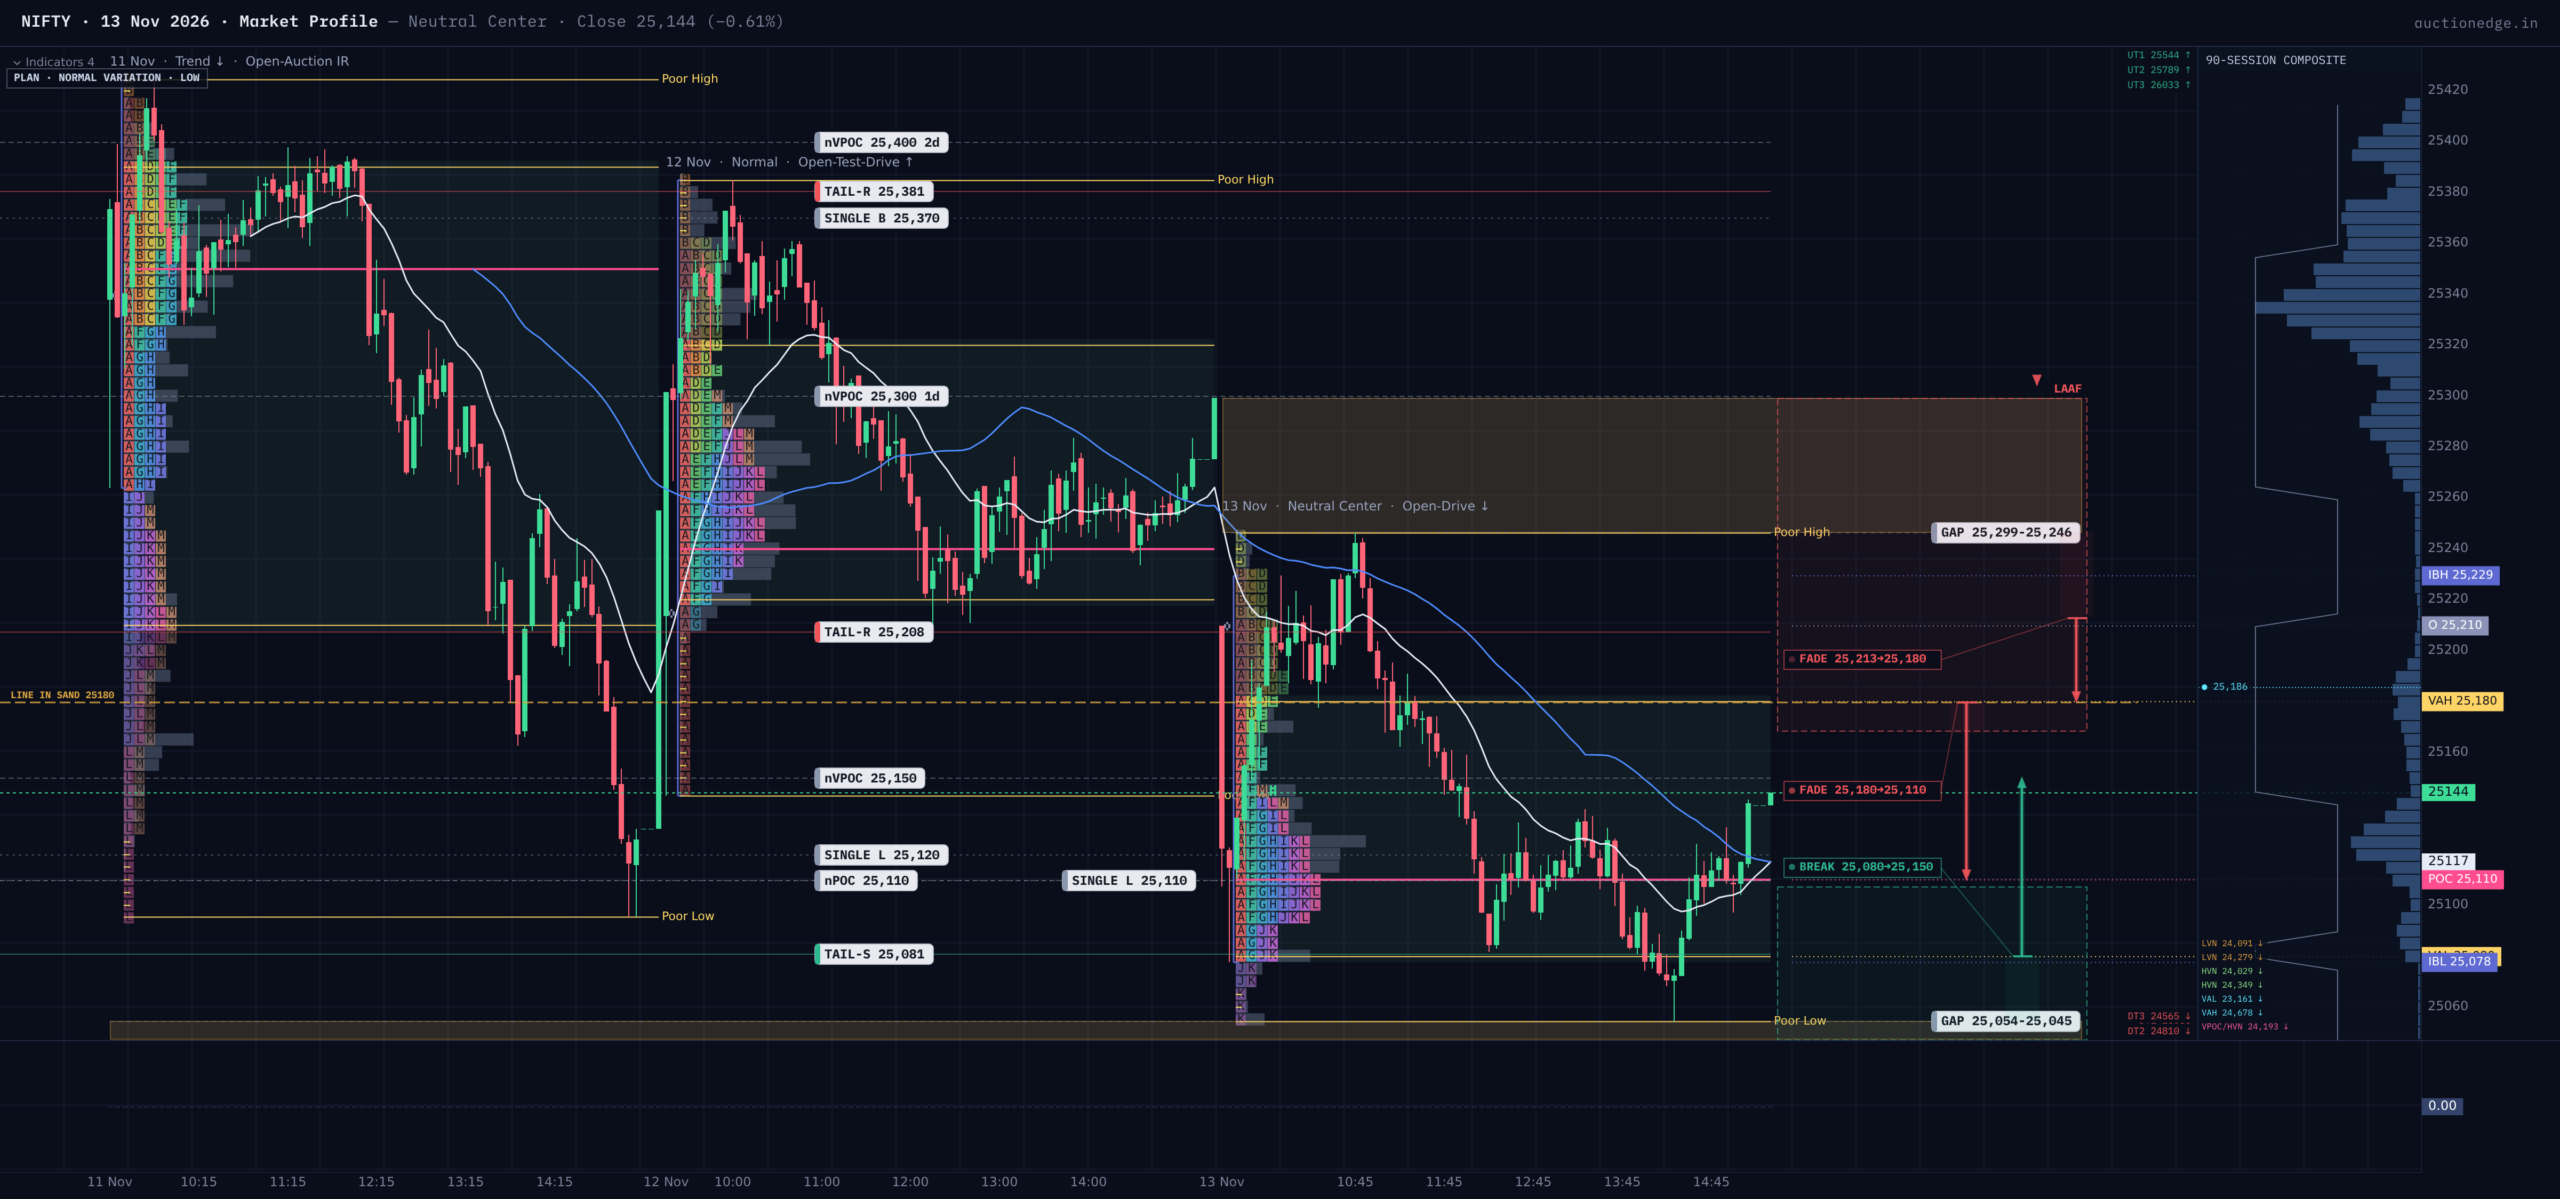
- Friday was a Neutral-Center day: range extended both ways and the close sat mid-range, but value built entirely below Thursday’s, so the market accepted lower prices without seller follow-through.
- Monday: expect rotation inside Friday’s 25054–25246 range. 25180 is the line: acceptance above repairs the gap, while trade below it keeps the 25030 floor in play.
MACRO CONTEXT
The last completed week opened near 23222 and closed on its high at 25030. That was the second straight week of one-timeframe buying (each week’s low holding above the last), and weekly value migrated higher with it. Longer term, price sits in the upper part of a multi-year range, above its high-volume center near 24220. Our composite read stays mildly bullish, though the 50-day average is still below the 200-day. Friday was a pause against the trend, not yet a reversal of it.
How the Day Unfolded: Who Controlled the Auction
NIFTY gapped 90 points lower to open at 25210, below Thursday’s value area (the zone holding ~70% of the day’s trade). The first half-hour drove down toward 25078, an open-drive (an open that pushes one way immediately), but by the third half-hour buyers had lifted price back through the open to the day’s high at 25246, briefly poking above the Initial Balance (the first hour’s range, 152 points here). That probe drew no new buying, and sellers worked price down to pierce the first-hour low at 25054 late in the day. A closing rally then lifted price to 25144, 47% of the way up the range. Extension on both sides with a mid-range close is the classic Neutral-Center day: both longer-term sides participated, and neither won.
Timing matters: the early upside break was rejected at once, while the downside break came only in the afternoon, which points to hesitant selling, and buyers answered it.
Even so, value tells the more important story. Friday’s value area (25080–25180), centered on a point of control (the most-traded price by time) at 25110, sat entirely below Thursday’s 25220–25320, with no overlap. Volume-based value shifted lower too, so time and volume agree. The close softens that verdict: it finished above the time-based center and just under the heaviest-volume price at 25150, so the late selling found no fresh takers.
The anchored VWAPs (session-weighted average prices) supply the backbone. Friday’s session VWAP at 25168 sat below Thursday’s 25314, which sat below Wednesday’s 25347. Each auction cleared lower than the last, a seller-leaning structure. Price also closed below the week-to-date VWAP at 25213, which makes that the key overhead pivot. The longer rolling VWAPs remain bullishly stacked, as backdrop only.
Volatility Cross-Check
Friday’s 192-point range was barely half the 20-day average true range of 345 and narrower than Thursday’s 242, so this was compression. Implied volatility near 13 is falling and runs slightly under realized movement, yet still counts as fairly priced. Intraday swings match what options imply, so standard profile levels should hold.
Balance and Structural Zones
Overhead, the first ceiling is 25169–25246, where Friday’s sellers rejected price. The weekly VWAP and Thursday’s value low at 25220 both sit inside it. Beyond that are Thursday’s naked POC at 25300 (a prior day’s high-volume price not yet retested) and a selling zone at 25337–25385. That zone also holds the 25368 measured-move target from the late-October breakout. Below price, Friday’s buying zone runs 25054–25107, and under it is the key confluence at 25030. That level is the top of the 40-day balance (multi-week trading range), a naked POC from November 9, and the edge of a partly filled gap down to 25054. Options maximum pain at 25150, right at the close, describes the same balance, as context rather than forecast.
Historical Statistics
History shows a slight lean higher but no decisive edge. After open-drives lower (n=467), the next session rose 51% of the time and fell 38%, and every edge score sits near zero. Exact analogs (n=8) rose 62.5% of the time, too thin a sample to lean on.
Opening Playbook
- Inside value (25080–25180): Balance continues. Sell near 25168–25180, where session VWAP and the rejection zone cluster, targeting 25110. Medium confidence.
- Below value, inside range (25054–25080): Buy a failed probe of Friday’s low only on a quick return above 25080, target 25150, invalidation below 25030. Medium confidence.
- Above value, inside range (25180–25246): A stall under 25213–25246 is a fade toward 25180. Trap warning: longs face Thursday’s value low and the weekly pivot together. Low confidence.
- Below range (<25054): Short only on acceptance below 25030, targeting 24910. Trap warning: three references stack at 25030, and a reclaim of 25080 flips the trade. Low confidence.
- Above range (>25246): Holding above Friday’s high targets the 25300 naked POC. Trap warning: 25337–25385 is fresh overhead supply. A return under the weekly VWAP at 25213 invalidates. Low confidence.
Game Plan / Bottom Line
The primary expectation is a Normal Variation or rotational session inside Friday’s range (50%). A downside break that tests 25030 (25%) and an upside repair toward 25300 (25%) are the alternates. With weekly expiry on Tuesday, let the first hour show who acts first.
Line in the Sand & Key Levels
LINE IN THE SAND: 25180. Above 25180, the bias tilts higher toward 25213–25246 and the gap begins to repair. Below 25180, the lower value is accepted and 25080–25030 becomes the path.
- 25385–25337 | Selling zone + measured-move target | Fresh overhead supply
- 25300 | Naked POC | First upside magnet
- 25246 | Day high | Range-break trigger
- 25213 | Weekly VWAP | Key pivot
- 25180 | VAH | Line in the sand
- 25150 | Volume POC | Close magnet
- 25110 | POC | Fair-value center
- 25080 | VAL | Lower value edge
- 25054 | Day low | Range-break trigger
- 25030 | Balance high + naked POC + gap | Major floor
Session Learning Note
Value can move decisively while price goes nowhere. A mid-range close does not erase a non-overlapping value shift. It only means the side that moved value failed to press, so the next session has to choose which footprint to honor.