Friday opened with a 146-point gap down, and the question was whether Thursday’s trend had run out of buyers. It hadn’t. The open became the day’s low, and buyers drove a 464-point range to close just under the high.
EXECUTIVE SUMMARY
- Weekly buyers have pushed higher three weeks running, but price is now in the upper quarter of a multi-year range, with February’s sellers overhead.
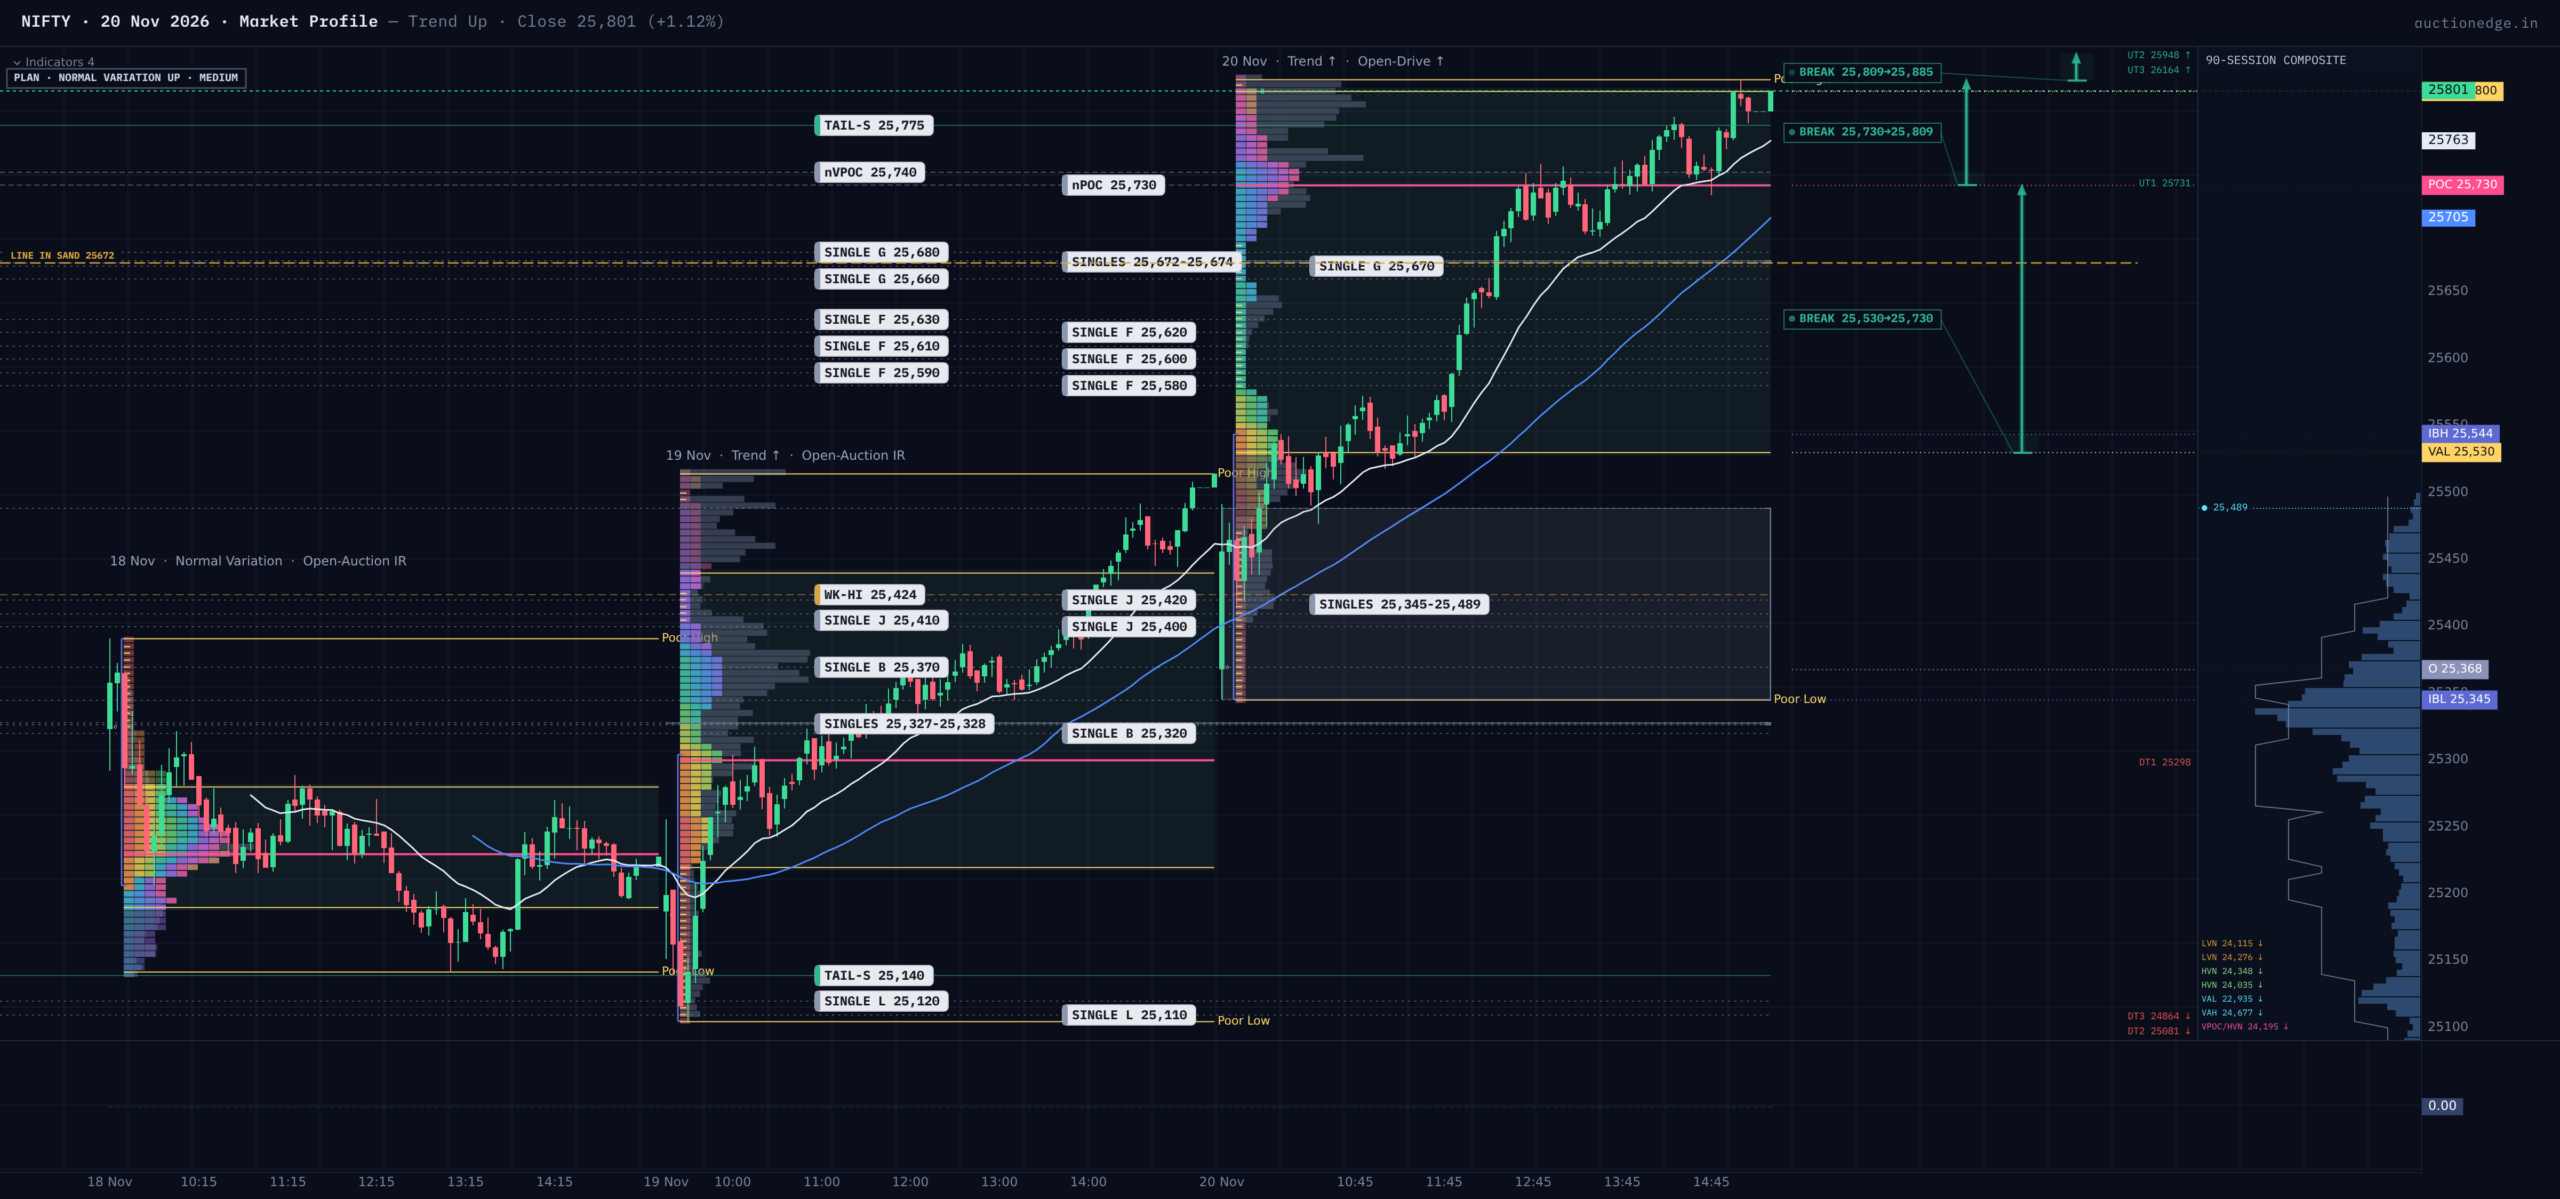
- Friday was a second straight Trend Day up. The open gap was erased immediately, value moved fully above Thursday’s, and the close came at 98% of the range.
- Monday’s base case is a Normal Variation day up that tests supply at 25,809–25,907. The line in the sand is 25,672.
MACRO CONTEXT
Weekly buyers have one-timeframed higher for three weeks (each week holding above the prior week’s low). Daily value has risen in three of the last four sessions, and our composite market read leans bullish. Price sits at about 88% of a balance dating back to mid-2024, testing long-term structural resistance. Friday went with the trend.
Who Controlled the Day
The gap opened at 25,368, inside Thursday’s value area (the zone holding ~70% of the day’s trade), exactly where a gap against a trend gets tested. Sellers couldn’t show acceptance. The low at 25,345 came in the opening minutes, and buyers took price straight back up. They left a 129-point buying tail (prices buyers grabbed too fast for two-sided trade to develop). This was an Open-Drive: buyers had decided before the bell and never let price revisit the opening range.
The Initial Balance (the first hour’s range) spanned 198 points, and price broke above it in the third half-hour. A break that early shows conviction from longer-term players. The profile then climbed in steps (pause, fast surge, pause), each higher than the last. The range beat Thursday’s 410 points and the 20-day average true range of 336.
The auction logic: Thursday’s buyers were partly responsive, picking up cheap prices after a failed break lower. Friday’s buyers were initiative from the first tick, buying the gap and paying up all afternoon. A counter-trend gap rejected this fast is a strong vote for the trend.
Where Value Went
Friday’s value area of 25,530–25,800 sits entirely above Thursday’s 25,220–25,440. That is a clean, non-overlapping move higher. Time and volume agree: the POC (the price with the most time traded) is 25,730 and the volume POC is 25,740, so there is no hidden pocket of trapped traders. The close at 25,801 sat on the value area high, above fair value: initiative continuation, not short covering. The caveat: the top has no selling tail, so the auction ended on time, not on seller rejection.
The anchored VWAPs tell the same story. Friday’s session VWAP at 25,632 is above Thursday’s 25,375, which is above Wednesday’s 25,245, a rising staircase of daily fair prices. The week-to-date VWAP at 25,420 is the swing pivot. The VWAPs are spread out, not coiled, so the trend is already moving. The rolling VWAP stack stays bullish in the background.
Volatility Cross-Check
Implied volatility fell into a low regime (11.8) within two sessions while rotations run about 30% larger than options imply: supportive of continuation, but it argues for modest targets.
Balance and Structure
Price closed above the nine-day balance whose top, 25,514, is now the floor; the first algorithmic extension target is 26,434. Overhead, three February selling tails at 25,809–25,907 sit on top of a 281-day naked POC (an old high-volume price never retested) at 25,900. The gamma flip at 25,843 sits inside it, making this the heaviest supply on the map. Below, the thin single-period corridor from 25,580 to 25,690, including single prints at 25,672–25,674, is the trend’s spine.
Historical Statistics
Only a slight bullish lean: after 540 top-quartile closes, the next day rose 53% and fell 35% (edge 0.56). Ten low-volatility analogs of this day and open split 30% up, 40% down, with a median next range of 134 points.
Monday’s Playbook
Monday is the weekly expiry after a weekend; keep size modest.
– Above 25,809 (20%): A gap straight into February supply. Buy only after two half-hours of acceptance above 25,809, aim for 25,885, stop under 25,785. Trap Warning: a gap here may be exhaustion after two trend days. If price slips back under 25,809, sell toward 25,730 with a stop above 25,907.
– 25,800–25,809 (10%): An open on the high. Wait for the first half-hour. Acceptance above 25,809 plays as above. A stall points to a rotation back to value.
– Inside value, 25,530–25,800 (50%): The trend stays intact. Buy holds of 25,730–25,740 for a retest of the high, with a stop under 25,672.
– 25,345–25,530 (15%): The gap fades Friday’s gains. Buy only after two half-hours back above 25,530, targeting 25,730, with a stop under 25,489. Trap Warning: repeated trade inside the buying tail means the trend has failed.
– Below 25,345 (5%): Full rejection of Friday. Short if the first half-hour cannot reclaim 25,345, aiming for 25,220, with a stop above 25,375.
Game Plan / Bottom Line
Two trend days and a rejected gap say this is not a market to fade. But low implied volatility, stretched rotations and heavy February supply right overhead favor a slower, two-sided Monday. Expect buyers to defend value and probe 25,809–25,907, where sellers decide if the trend extends.
Line in the Sand
25,672. Above it, the bias stays higher and dips toward fair value are buyable. Below it, the thin corridor is pierced, and price likely fills quickly toward 25,530–25,544.
Key Levels
- 25,990–26,009 | Naked POC + selling tail + call wall | Major ceiling
- 25,900 | Naked POC (Feb) | Magnet inside supply
- 25,843 | Gamma flip | Heaviest overhead pivot
- 25,809 | Day high, no selling tail | Continuation trigger
- 25,730–25,740 | POC / volume POC | Fair value
- 25,672 | Single prints | Line in the sand
- 25,530–25,544 | Value area low / IB high | Trend-read floor
- 25,514 | Balance top / Thursday high | Breakout floor
- 25,420 | Week-to-date VWAP | Swing pivot
- 25,345 | Day low | Base of buying tail
Session Learning Note
A gap against an established trend is a question, not an answer. Two half-hours of trade beyond the gap mean the trend may be breaking; a fast return through the open reaffirms it. The faster a counter-trend gap is rejected, the stronger the confirmation.