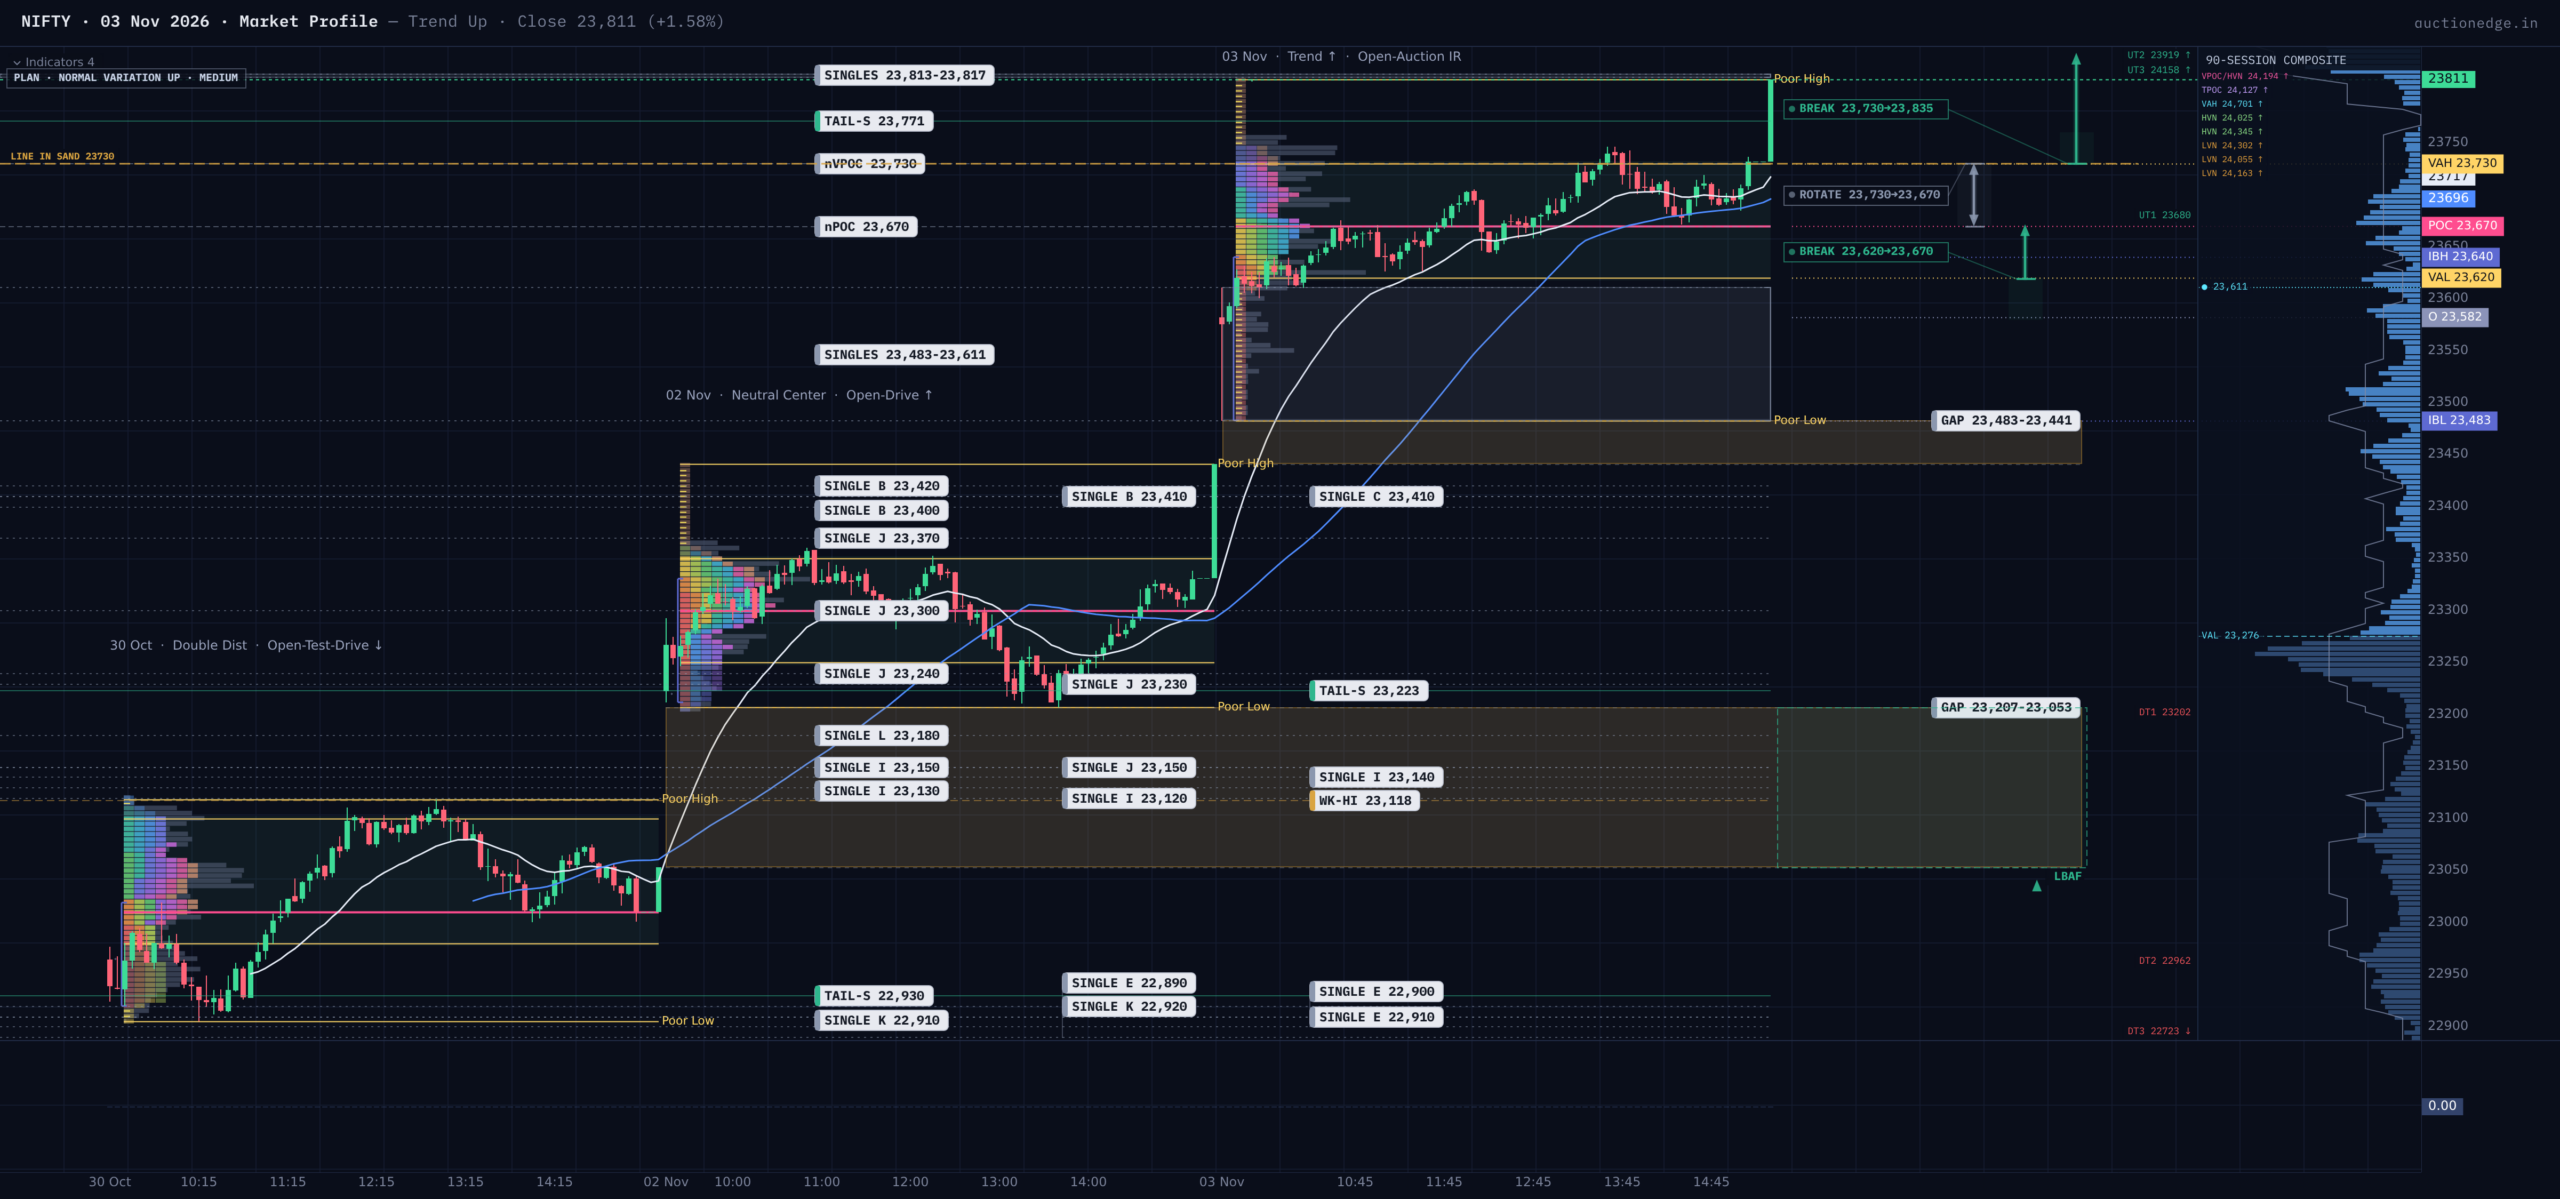
The question coming into Tuesday was whether Monday’s late burst higher was real conviction or just a closing squeeze. The market answered emphatically: buyers gapped it up, never gave the open back, and closed on the high at 23,811.
EXECUTIVE SUMMARY
- Macro: Value has risen four sessions running, but the 50-day average still trails the 200-day, so this is a strong recovery inside a larger downtrend, not yet a reversal.
- Tuesday: A 141-point gap up became a one-way Trend Day (price keeps pushing one direction) that closed on its high, entirely above Monday’s value.
- Wednesday: 23,730 is the line in the sand; holding above keeps buyers in charge, while a slip below invites a rotation back toward 23,670.
MACRO CONTEXT
Last week closed at 23,053, and its value area (the zone holding about 70% of the week’s trade) sat at 22,540 to 22,860, above the week before; daily value has now stepped higher four sessions in a row, so Tuesday moved with the short-term trend. Against that, the 50-day average (23,234) remains below the 200-day (24,013), and price still sits in the lower half of an 848-day balance (a long sideways range) running from roughly 21,700 to 26,400. Our composite read is neutral: a market recovering fast, but not yet proven.
Who Controlled the Day
Tuesday opened at 23,582, outside Monday’s entire range, and dipped to 23,483 in the first half hour. That dip left a buying tail (a spike of prices sellers pushed to and buyers rejected at once) from 23,483 to 23,611, proof that sellers had no follow-through. The Initial Balance (the first hour’s range, 23,483 to 23,640) was then broken upward almost immediately, in the third half hour. An early break like that signals conviction from longer-term, other-timeframe buyers (participants who hold for days, not hours) rather than intraday traders. From there the day stair-stepped higher, each half hour’s range a little above the last.
The fair-price zone formed at 23,620 to 23,730, centred on 23,670, with no overlap with Monday’s 23,250 to 23,350. That is acceptance, not a probe: buyers were allowed to do business at the new prices. The heaviest volume printed at 23,730, 60 points above the time-based centre, and the close sat above both. Volume-weighted agreement at higher prices means the late buyers were comfortable paying up rather than trapped. One caution: the final half hour ran from 23,732 to 23,811 on a thin line of single prints (price traded there only once), and the market closed on the high with no rejection. Nothing has told us the upward auction is finished.
Volatility, Anchored VWAPs and Balance
The 328-point range was 1.2 times the five-day average, a 1.55-sigma move (about one and a half standard deviations); intraday swings are in line with what options imply, while options are priced above recent realized movement, so ordinary level reliability applies. Today’s session VWAP (volume-weighted average price), 23,702, sits above yesterday’s 23,360 and the day before’s 23,071: a rising stack, each auction clearing higher. The week-to-date VWAP at 23,553 is the first meaningful pivot below; the anchored lines are spread out, not coiled, and the longer rolling averages are mixed backdrop only. Price also broke above the late-October trading range, whose measured-move extension sits near 24,619.
Structure Around Price, and What History Says
Directly overhead is a stack from September: single prints at 23,813, a selling tail from 23,836 to 23,890, an untested volume POC at 23,880 and a small gap to 23,896. Below, the 141-point gap from 23,441 to 23,582 is the main cushion. The history is thin: after closes in the top quarter of the range, the next day finished higher 52% of the time versus 36% lower (534 cases), a slight lean only, and the closest nine-case match split evenly. Note also that Tuesday was an options expiry day, which can exaggerate late moves.
Game Plan and Bottom Line
Wednesday’s primary expectation is continuation with friction: buyers favored while 23,730 holds, but a market that closes on its high usually opens near it and then has to prove itself into the September supply above. If the open lands:
– Inside value (23,620 to 23,730): expect rotation; fade the edges toward 23,670 and wait for the first hour.
– Between 23,483 and 23,620: responsive buyers should defend the buying tail; a move back to 23,670 is the first test.
– Between 23,730 and 23,811: buy only pullbacks that hold 23,730; the 23,836 tail is the first obstacle.
– Below 23,483: the whole day is being given back; the gap bottom at 23,441 is the next reference.
– Above 23,811: trap warning into 23,813 to 23,896; fade only if price fails back inside.
LINE IN THE SAND: 23,730. Above it, the bias is higher value and a test of the 23,836 tail. Below it, the bias is a rotation back toward 23,670.
Key Levels
- 23,896 | top of the small gap | overhead supply edge
- 23,880 | untested volume POC | magnet and likely rejection zone
- 23,836 | base of the September selling tail | first obstacle above the high
- 23,811 | Tuesday’s high and close | level buyers must hold
- 23,730 | VAH and volume POC | line in the sand
- 23,670 | time-based centre of value | rotation target
- 23,620 | VAL | edge of Tuesday’s value
- 23,582 | open and top of the gap | gap defence
- 23,483 | IB low and day low | full give-back below
- 23,441 | bottom of the gap, Monday’s close | complete gap fill
Session Learning Note
When a market gaps away from a fresh value area and never returns to its opening level, the initiative is genuine; but until a rejection tail appears at the high, the upward auction is open, so the first hour of the next session tells you whether buyers are still being paid.