The question coming into Tuesday was whether sellers, after a 318-point break on Monday, had more to give. The answer was a swift early flush, a full recovery, and a close near the highs. That looks strong, but the shape of the recovery matters more than its size.
EXECUTIVE SUMMARY
- The broader trend is firmly down: every timeframe we track is aligned bearish, and price sits in the lower quarter of its long-term range.
- Today was a P-shape day (a rally that stalls, often short-covering rather than fresh buying) after Monday’s long-liquidation break.
- Tomorrow’s line in the sand is 22730, the top of today’s value area; acceptance above it would challenge the bearish default.
MACRO CONTEXT
The week ending 25 September closed at 23140, below where it opened, and value has now stepped lower four sessions running. Our composite market read is at its most bearish setting, with short-, medium- and long-term averages stacked in bearish order. Today’s 22716 close broke below the 15 to 23 September trading bracket, so that bracket’s former floor now sits overhead as a reference. Monday’s move was with the trend; today’s bounce was against it.
How the Day Unfolded
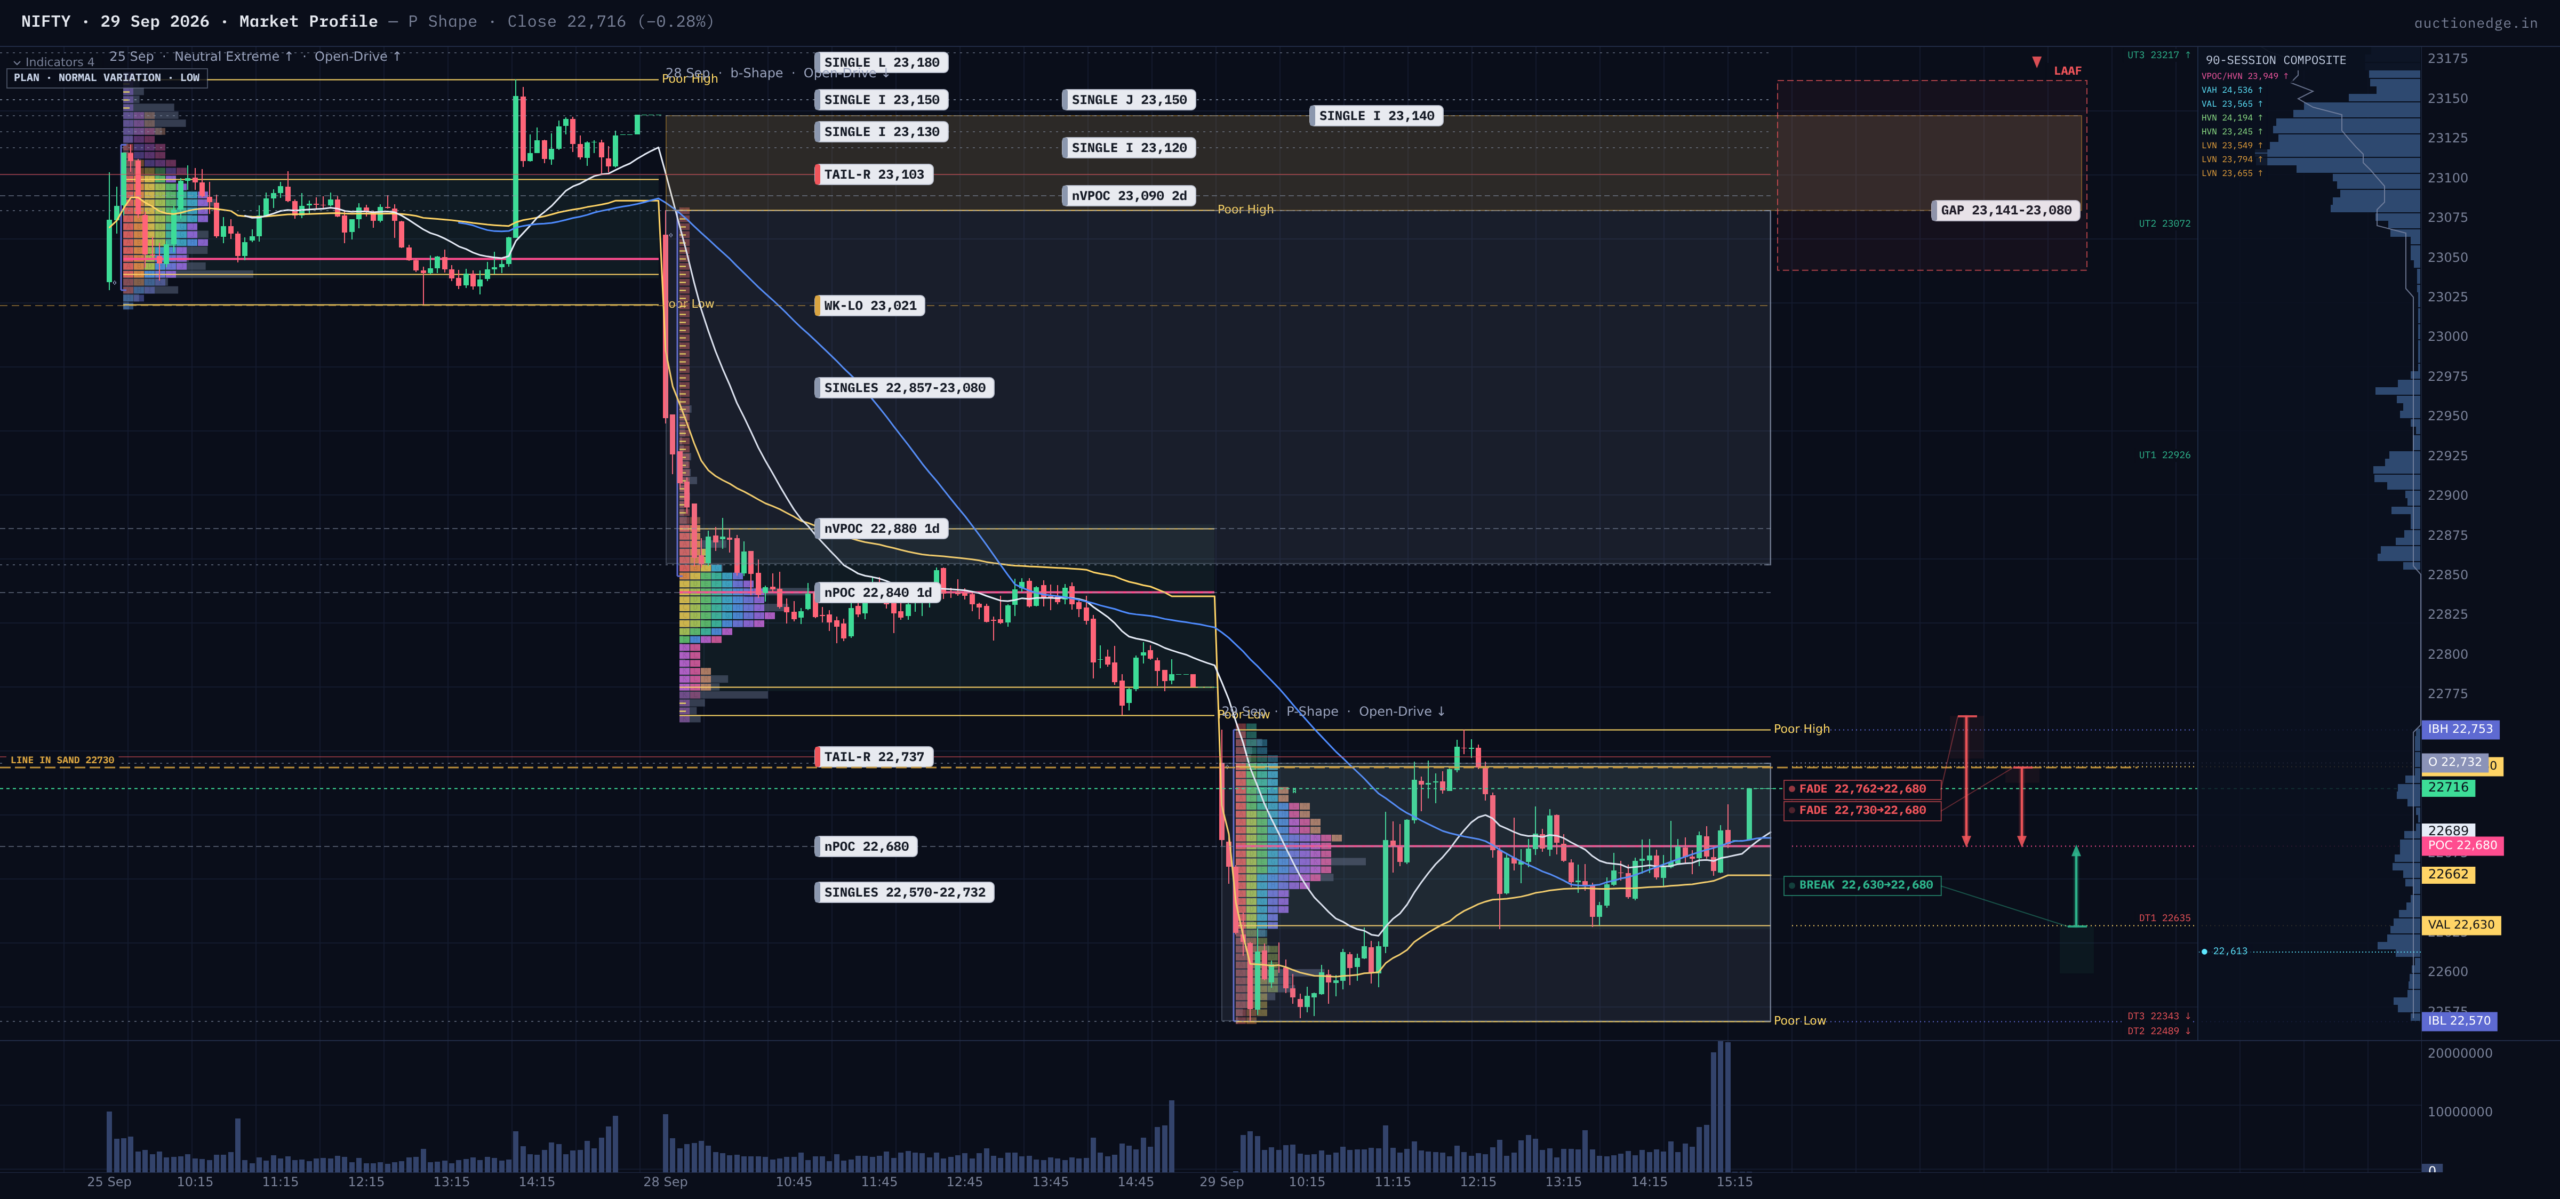
NIFTY gapped down 48 points and drove straight lower at the open, an Open-Drive (an open that runs one way without looking back), bottoming at 22570 within the first hour. That is the type of open that usually holds its extreme, and the low did hold. But the reason it held is instructive: sellers ran out of business, not buyers out of patience. Price rotated back through the open, broke the Initial Balance (the first hour’s range) to the upside, and the profile thickened in the upper half, the classic P-shape. Because the rebound came from participants covering existing shorts rather than new capital chasing higher prices, it deserves less trust than its 80% close location suggests.
Value migrated lower again, to 22630-22730 from Monday’s 22780-22880, with no overlap. That is the acceptance story: the market spent its time, and its volume, below where it accepted value yesterday. The footprints tell you who acted: a lone buying tail (a quick rejection of low prices) at the bottom shows responsive buyers stepping in at 22570, while a small selling tail at 22720-22753 shows buyers were turned back near the top of the day. The IB broke up but never extended meaningfully beyond the high, so the upside move never looked like an all-day, one-sided auction.
Time and volume agreed: the point of highest activity by both measures was 22680, so there is no hidden divergence to worry about. The market closed 36 points above that level, a modest premium rather than a stretch.
Volatility Cross-Check
Implied volatility is elevated relative to what the market actually delivered (0.44 of a standard move today), so option premium looks generous and our standard levels are less reliable than usual; widen stops and targets about 30%.
Balance and Structure
The market is now below the multi-week balance (a range where two-way trade built up) around 23140 to 23400, which puts measured-move downside references at 22162 and 21686 if that break proves genuine. Three zones matter for tomorrow. First, the gap left this morning between 22732 and 22762: unfilled gaps tend to attract price, but a gap that is a seller’s overhang tends to cap it. Second, Monday’s untested high-volume midpoint at 22840, together with the selling tail above it, is the next serious overhead reference. Third, today’s own midpoint at 22680 is untested from above and sits just below the close, where it acts as a magnet.
The anchored VWAPs (volume-weighted average prices for each recent day) are stacked in descending order, today’s 22671 below yesterday’s 22881 below 23130 from two days ago, which is bearish structure. The week-to-date VWAP at 22770 is the level buyers must reclaim to change that; we are below it.
What History Says
Statistics lean slightly bullish (top-quartile closes were followed by higher prices 53% of the time, n=526), but every edge is below 1.0, so treat it as a slight lean, not evidence. It clashes with what the P-shape and the trend say, and that clash is the reason our conviction is low.
Opening Playbook
Rough weights: continuation lower or a fade of any strength, 45%; balanced rotation around today’s value, 35%; genuine upside acceptance, 20%.
- Inside value (22630-22730): Sentiment is unchanged; rotate, fade the edges and let the first hour decide. The 22680 midpoint is the pivot.
- Below value, inside the range (22570-22630): Buyers defended this area today. A reclaim of 22630 targets 22680; failure through 22570 hands control back to sellers.
- Above value, inside the range (22730-22753): The gap and the selling tail overlap here. A trap warning applies: strength into this zone is a fade candidate, invalidated only by acceptance above 22762.
- Below the range (below 22570): A break of the opening-drive low is a continuation signal with 22489 the next reference; the older buying tail at 22543-22555 may cause a pause.
- Above the range (above 22753): Trap warning again. A gap up meets the unfilled gap edge at 22762, then 22840; without initiative buying above 22762, the fade offers the better risk.
Line in the Sand
Above 22730 with acceptance, the short-covering has drawn in real buyers and the bias turns neutral to constructive. Below 22730, the market is still trending down inside a bounce.
Session Learning Note
A strong close is not the same as a strong auction: watch who is doing the buying, not where the day finished.
Game Plan
The default expectation is that the prior downtrend resumes once covering fades, with a probable test of 22680 and then the low. It is a lean, not a certainty: an open above 22730 with initiative buying would force a reassessment.