Thursday’s collapse left the market badly stretched to the downside, so Friday’s question was simple: did real buyers show up, or did sellers just pause to cover their positions? The close gave a qualified answer.
EXECUTIVE SUMMARY
- Macro: the weekly trend is still down and value keeps stepping lower, with the market sitting in the lower quarter of its long-term range.
- Yesterday: a Trend Day down closing at the lows, which left shorts crowded and ripe for a squeeze.
- Tomorrow: the 22,460 fair-price floor is the line in the sand; holding it keeps the squeeze alive, losing it hands control back to sellers.
MACRO CONTEXT
Last week’s value area (the zone holding about 70% of trade) sat well below the week before, and the market has been stepping lower week after week, a one-way pattern. The 50-day average has crossed below the 200-day (a “death cross”), and price sits in the lower quarter of a very large multi-year range, testing its floor. Thursday was with that trend; today was a counter-trend bounce inside it. Our composite market read stays bearish, and this rally does not change it on its own.
Who Controlled the Day
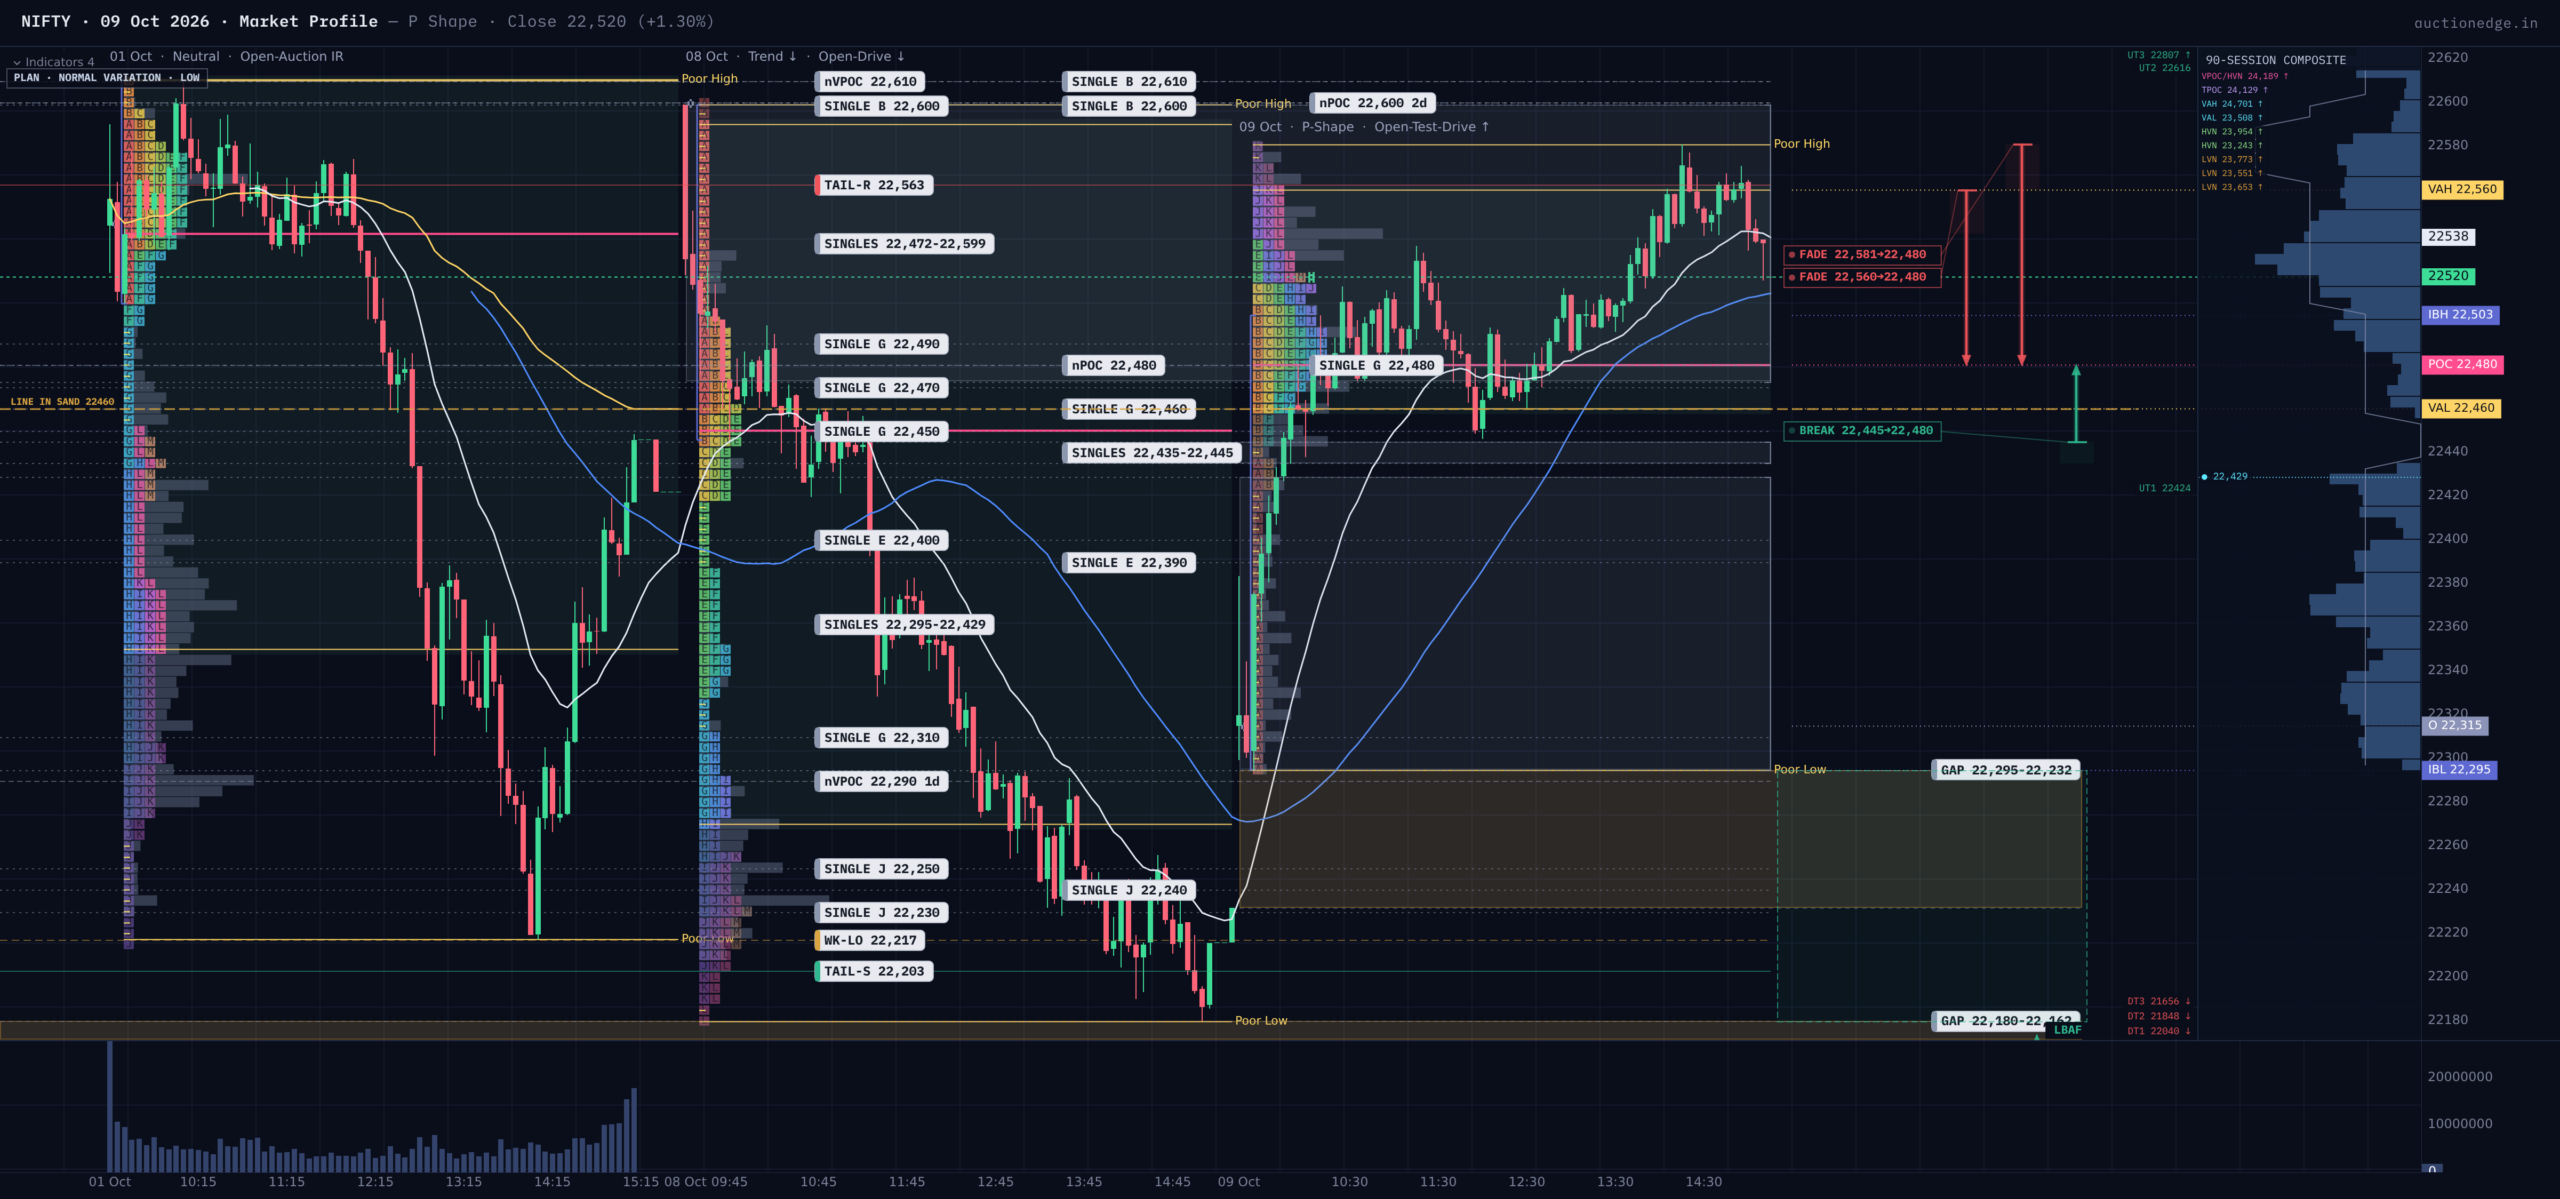
Buyers drove the first half of the session. The market opened with a gap up of 83 points, probed lower to 22,295 to see whether sellers still had business there, found none, and then drove back through the open. That left a 132-point buying tail (prices buyers rejected quickly on the way up), the day’s most important footprint. The Initial Balance (the first hour’s range) was 208 points and broke upward almost immediately, an early sign of conviction.
But conviction faded. After the early burst, each push stalled lower than the last high, and most of the afternoon was spent trading in a narrow band between 22,460 and 22,560. That produces a “P” shaped profile, the classic mark of short covering: traders already short buying to exit, not new capital building long positions. Range was 286 points, about 1.15 times the 20-day average, so it was a lively day but not a runaway one.
Value and Acceptance
Value (the day’s 70% zone) formed at 22,460-22,560 with a time-weighted center at 22,480. That sits entirely inside yesterday’s much wider value area, so value did not migrate, it overlapped. Sellers did not lose control, they simply lost momentum. The close at 22,520 landed in the upper part of the day’s range, above the center, which is constructive, yet price never accepted above 22,560.
Volume tells a slightly different story: the busiest price by volume was 22,610, well above the busiest by time. Heavy trading happened higher, but price could not stay there, which suggests early buyers’ conviction was tested and some of them sit trapped near the highs.
Reference Levels That Matter
Overhead, a selling tail from today at 22,544-22,581 sits just beneath yesterday’s tail at 22,581-22,599, partly filled; together they form the first real ceiling. Above that, untested high-volume prices at 22,600 and 22,610 act as magnets and as supply. Below, a thin patch of single prints (a quickly traversed price zone that often gets retested) at 22,435-22,445 is first support, followed by the buying tail down to 22,295. Anchored VWAPs (volume-weighted average prices for each recent auction) are mixed: today’s 22,540, yesterday’s 22,391 and two days ago 22,672 are not in a clean order, and the weekly VWAP at 22,584 caps the close. The market is in transition, not a coil. The longer rolling averages all sit far above price and confirm the bearish backdrop.
Balance and Volatility
Price is inside a nine-day trading area from 22,180 to 22,776, centered near 22,552, so tomorrow begins from balance rather than from a breakout. As a cross-check, options priced about 11% implied volatility while realized movement ran near 20%, so the market is moving more than options expected; that favors an outsized move once a direction is chosen.
Historical Lean
Statistics are modest. After a P-shape on a Friday, the next day rose 65% of the time (23 cases), but combinations with this open type lean slightly the other way, 52% down across 21 cases, and the closest analogs (17 sessions) were 47% down against 35% up. That adds up to a slight upward lean in one lens and a downward lean in another: no decisive edge.
Opening Playbook
- Inside value (22,460-22,560): fade the edges and wait for the first hour; a fade from the top toward the 22,480 center is favored while the selling tail holds.
- Between value and the lower end of the range (22,295-22,460): first responsive buying near the single prints at 22,435-22,445, targeting the center.
- Between the upper edge of value and the high (22,560-22,581): fade into the selling tail.
- Below the range (under 22,295): the squeeze has failed; sellers are likely to press toward the 22,180-22,226 buying tail, but a quick rejection back into range invites buyers.
- Above the range (over 22,581): trap warning. The gap runs straight into untested supply at 22,600-22,610 and the 22,674-22,718 tail; acceptance above would signal new buying.
Session Learning Note
A strong open that cannot build volume-confirmed acceptance higher is often an inventory adjustment, not a trend change.
GAME PLAN / BOTTOM LINE
Monday’s primary expectation is more balance between 22,460 and 22,560 while the market decides if Thursday’s selling is finished. Sellers still hold the structural edge above, but 22,295 holds the bounce’s credibility.
LINE IN THE SAND: Above 22,460 the bounce is intact and the bias is neutral-to-constructive; below 22,460 the bias returns to bearish.
KEY LEVELS (high to low):
– 22,718-22,674 | selling tail | untested supply above the volume centers
– 22,610 | volume center | busiest price by volume, untested
– 22,600 | naked time center | untested magnet from Wednesday
– 22,581 | day high | today’s selling tail edge
– 22,560 | value high | top of today’s fair-price zone
– 22,480 | center of value | pivot for rotations
– 22,460 | value low | line in the sand
– 22,445-22,435 | single prints | first support below value
– 22,295 | day low | base of today’s buying tail