EXECUTIVE SUMMARY
- The weekly trend is one-timeframing lower for a second straight week and every major trend lens — the VWAP stack, the moving-average stack, and the 50/200-day cross — is now aligned bearish, with the composite market read pinned at its most negative reading.
- Yesterday’s rally was exposed as short covering, not new buying: the P-shaped profile left an unresolved high, and today the market gapped away from it and never looked back, closing at the bottom of a full trend-down session.
- Today’s value area sits entirely beneath yesterday’s with zero overlap; above 23,110 the market can still argue for stabilization, but below it sellers keep the initiative, and the only real support left nearby is a pair of month-old naked points of control near 22,980–22,900.
MACRO CONTEXT
The bigger picture has not budged. The week ending September 18 was the second straight week of value migrating lower, and today’s session continued that thrust in a single direction. Every intermediate trend lens agrees — the VWAP stack (5-day through 250-day), the moving-average stack, and the 50/200-day cross all read bearish, and the composite market score sits at its most negative level. Zoomed out further, price trades in the lower third of an 813-day balance area anchored near a 24,220 fair-value center — today’s action ran with that macro grain, not against it.
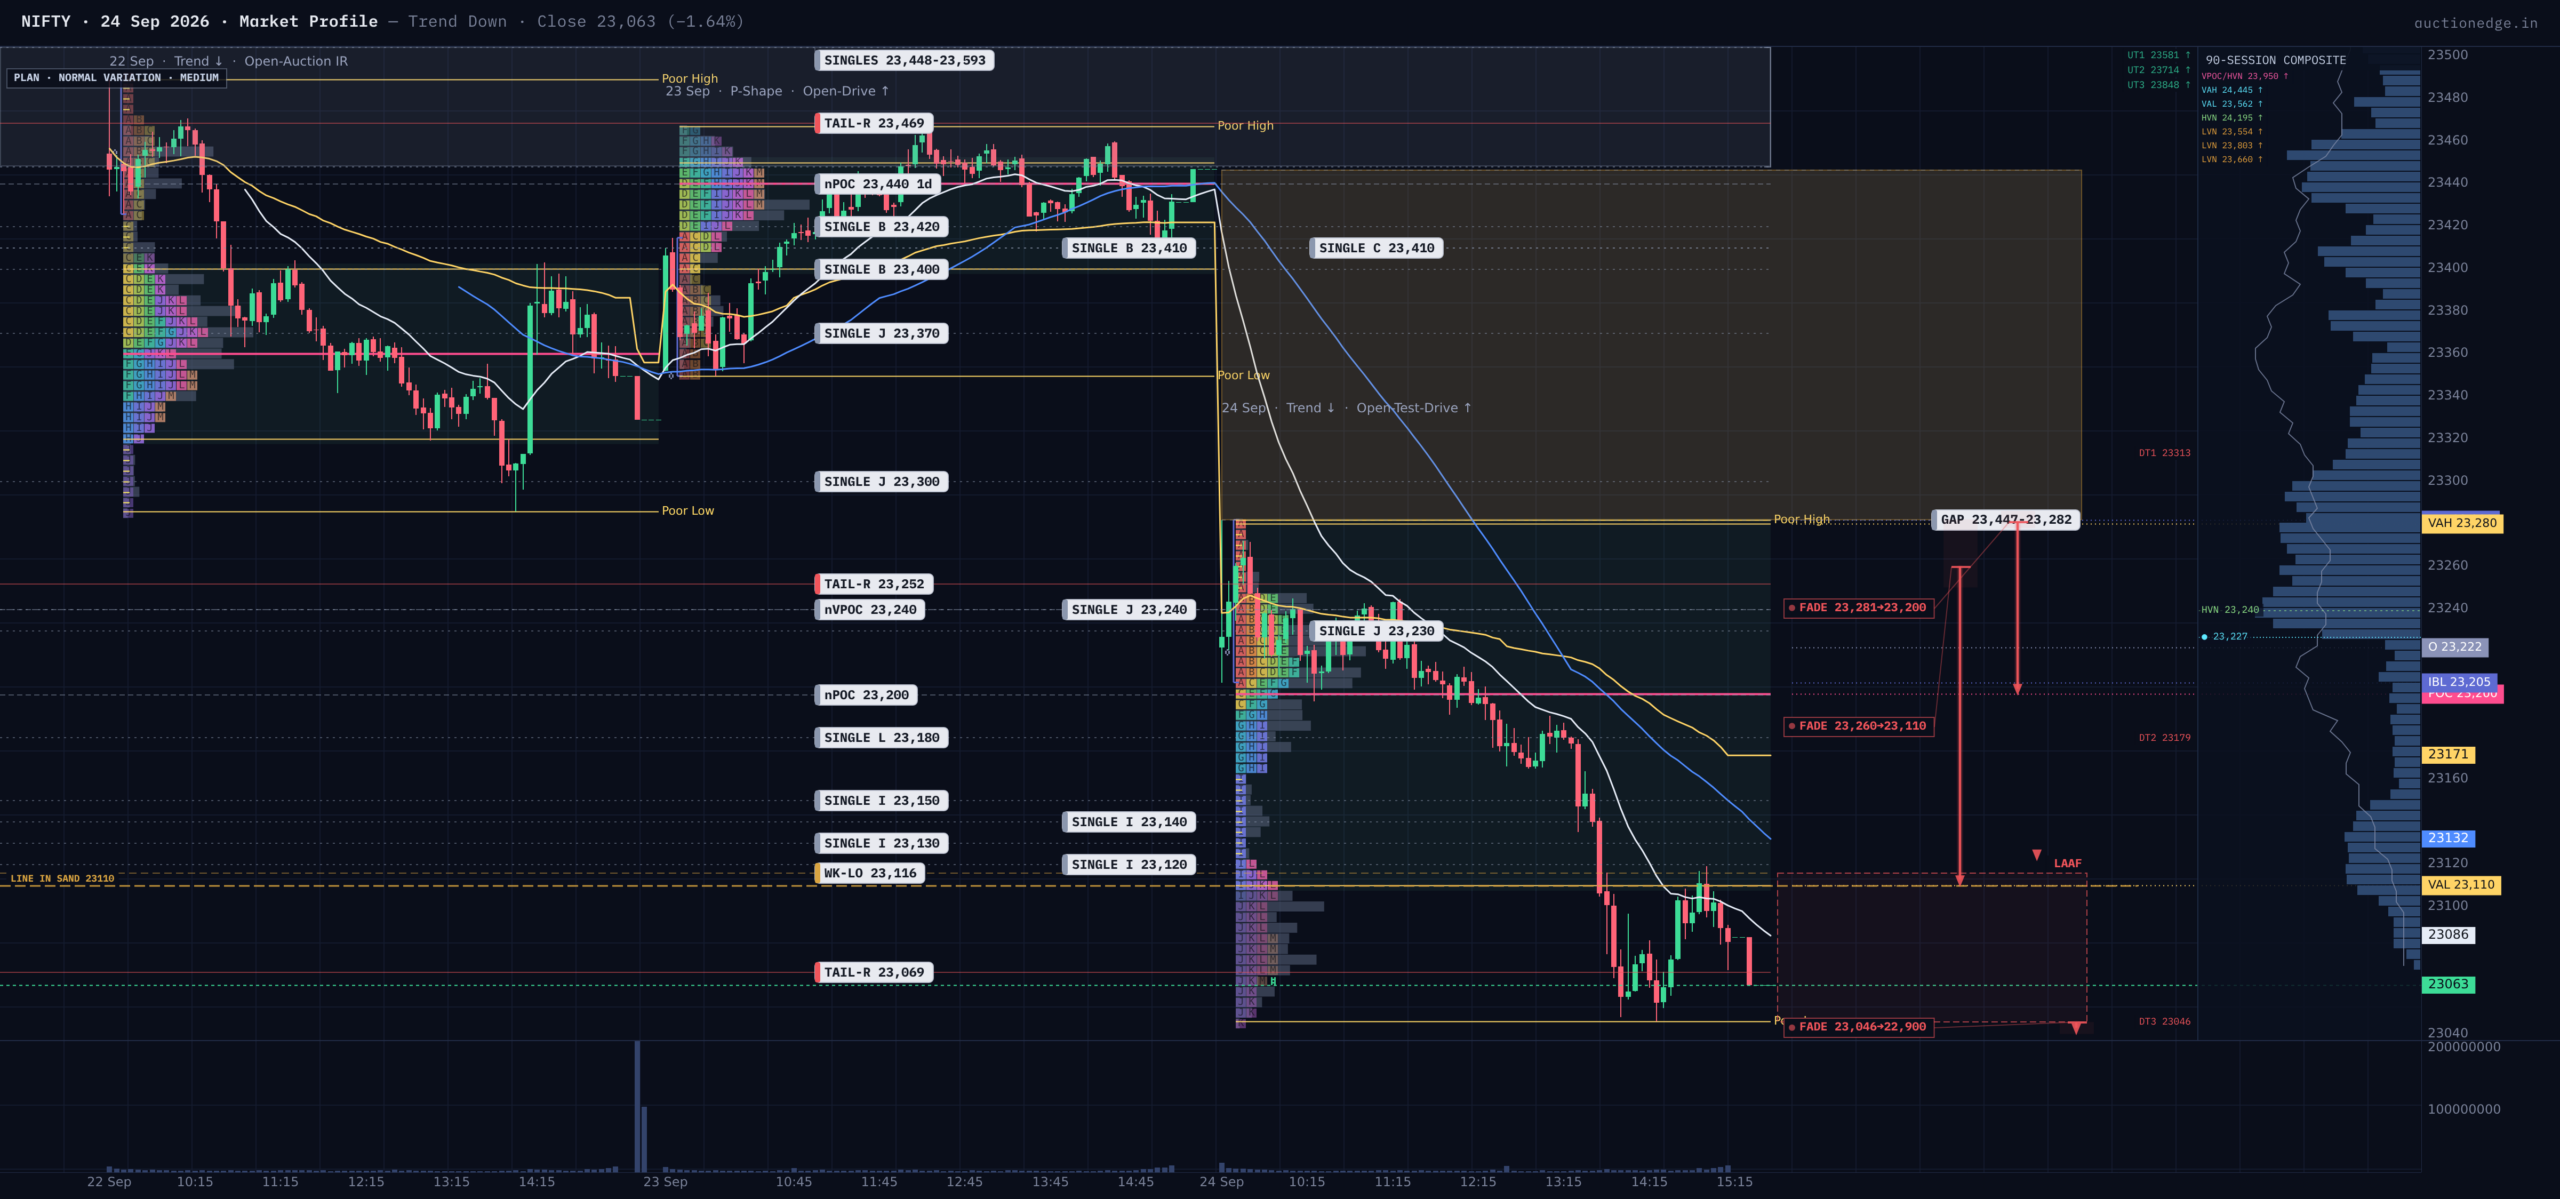
Today closed as a trend day lower, but not the textbook kind where the open itself is the extreme. Instead, the first hour (the Initial Balance — the market’s opening 60 minutes) printed the day’s only up-move, testing as high as 23,282 before other-timeframe sellers took the session away from the initial buyers. That morning test-and-drive higher looked like conviction; by the close it was fully negated — an early drive failing once price returned through, and then well below, its own opening range. From there the market fell almost continuously, half-hour period after half-hour period pressing to a new low into the final bell — the signature of sustained one-timeframe selling, not a single panic spike. The range extension beyond the Initial Balance ran to roughly double the Balance’s own width, the threshold Auction Theory treats as other-timeframe participants taking firm control, and today’s 236-point range was itself a nearly three-sigma move by the market’s own volatility measure — a rare, high-conviction session.
Value confirms the same story. Today’s value area (23,110–23,280) sits entirely below yesterday’s (23,400–23,450) with zero overlap — a clean, non-overlapping migration lower that both the time-based and volume-based points of control agree on (23,200 and 23,240, only 40 points apart). The close at 23,063 finished beneath both measures of value and near the bottom of the day’s range; price never traded back up to retest either point of control, so today’s own fair-value zone remains a fresh overhead reference, not yet revisited.
One volatility cross-check: the market’s own recent swings have been running about 70% larger than options pricing implies (an “expanded” rubber band), even as implied volatility itself has only just started climbing — options still catching up to, not yet capping, the realized move.
On the multi-day map, price has slipped to the floor of the nine-day balance built since mid-September (23,116–23,593) and beneath the tighter three-day balance from the past few sessions. The cleanest confirmed break remains the 19-day balance that gave way on September 18, whose measured-move framework still projects 21,960 and 21,137 as the next downside targets if sellers keep pressing.
Structurally, almost everything of consequence sits overhead. The failed morning test left its own selling-tail footprint at 23,222–23,282, with today’s unfilled opening gap (23,222–23,350) stacked on top. Further up, a heavier, still-largely-unfilled selling-tail cluster runs 23,489–23,593 — the top of the same nine-day balance — with an older unfilled gap at 23,593–23,623 beyond. Below price the cupboard is bare: today’s small buying tail sits just under the close (23,046–23,092), and beyond it only two stale, untouched April points of control near 22,980 and 22,900 remain.
The statistics basket is genuinely split. The broad seven-stat composite tags a mild bullish lean, but that is driven by lower-conviction, single-factor readings; the two most specific signals — the exact day-type-plus-open-type combination (13 instances, 62% down, the basket’s highest edge score) and the tightest historical fingerprint match for today’s regime (10 instances, 60% down versus 10% up) — both point the other way, toward downside continuation. Multi-factor reads like these carry more weight than the broader tally, so the statistical lean favors more weakness before strength.
For tomorrow: an open back inside value (23,110–23,280) argues for fading rallies into the selling-tail shelf around 23,240–23,282 back toward 23,110. An open below today’s low but still in range (23,046–23,110) offers only a thin, low-conviction bounce toward value. A print just above 23,280 sits inside the failed test-drive’s own selling tail — treat it as resistance, not breakout. A gap below the range runs quickly into the 22,980–22,900 magnet pair — trade with the gap. A gap above the range walks straight into the stacked overhead supply from 23,350 through 23,593 — a trap-warning zone for chasing strength.
LINE IN THE SAND: 23,110 — today’s value area low, essentially coincident with the floor of the nine-day balance (23,116). Above it, sellers’ control is being questioned and a stabilization case can build; below it, the trend-down read stays intact and the naked points of control near 22,980–22,900 become the next real magnets.
KEY LEVELS (high to low):
– 23,593 | Gap Bottom | Old unfilled gap boundary, distant overhead ceiling
– 23,489 | Selling Tail | Lower edge of the heaviest overhead cluster, running to the 9-day balance high
– 23,350 | Gap Top | Upper edge of today’s own unfilled gap
– 23,282 | Day High / IB High | Failed test-drive extreme, its own selling-tail top
– 23,240 | Volume POC | Today’s volume point of control, fresh naked reference
– 23,200 | TPO POC | Today’s time point of control, fresh naked reference
– 23,110 | VAL | Today’s value area low — Line in the Sand
– 23,046 | Day Low | Buying-tail cushion
– 22,980 | Naked POC | 170-day-old volume magnet, nearest real support
Session Learning Note: A confident-looking open-type label can still fail completely inside the same session — today’s early test-and-drive higher was fully erased by a one-timeframe decline that ran almost the entire day, a reminder that what a market does at 9:45 AM matters far less than what it holds onto by 3:30 PM.