The question into Friday’s close was whether today’s rebound off a gap-down open was the start of something real or just a pause inside a market that has been sliding for a month — the tape gave a genuinely two-sided answer.
EXECUTIVE SUMMARY
- Macro backdrop stays firmly bearish: a death cross, a bear-stacked VWAP structure, and four straight sessions of lower value areas confirm sellers still control the bigger picture.
- Today reversed a 208-point gap down into a trend-up close in the upper quartile of its range, but value itself still migrated lower — a rebound inside a downtrend, not yet a trend change.
- Line in the sand is yesterday’s value low near 23,410: reclaim it and the bounce can stretch into resistance near 23,530; lose it and the slide resumes toward 23,320 and below.
MACRO CONTEXT
The broader tape remains decisively bearish. Our composite market read sits at a strong-bear extreme, the rolling VWAP stack and moving averages are both fully bear-aligned (including a death cross of the 50- and 200-day averages), and the weekly value area has printed lower for four straight sessions — this week’s value (23,385-23,675) sits well beneath last week’s (23,850-24,040). The market is one-timeframing down on the weekly chart, with price in the lower half of the multi-month macro band, below its volume center of gravity near 23,910.
Day Type, Value & Who Was in Control
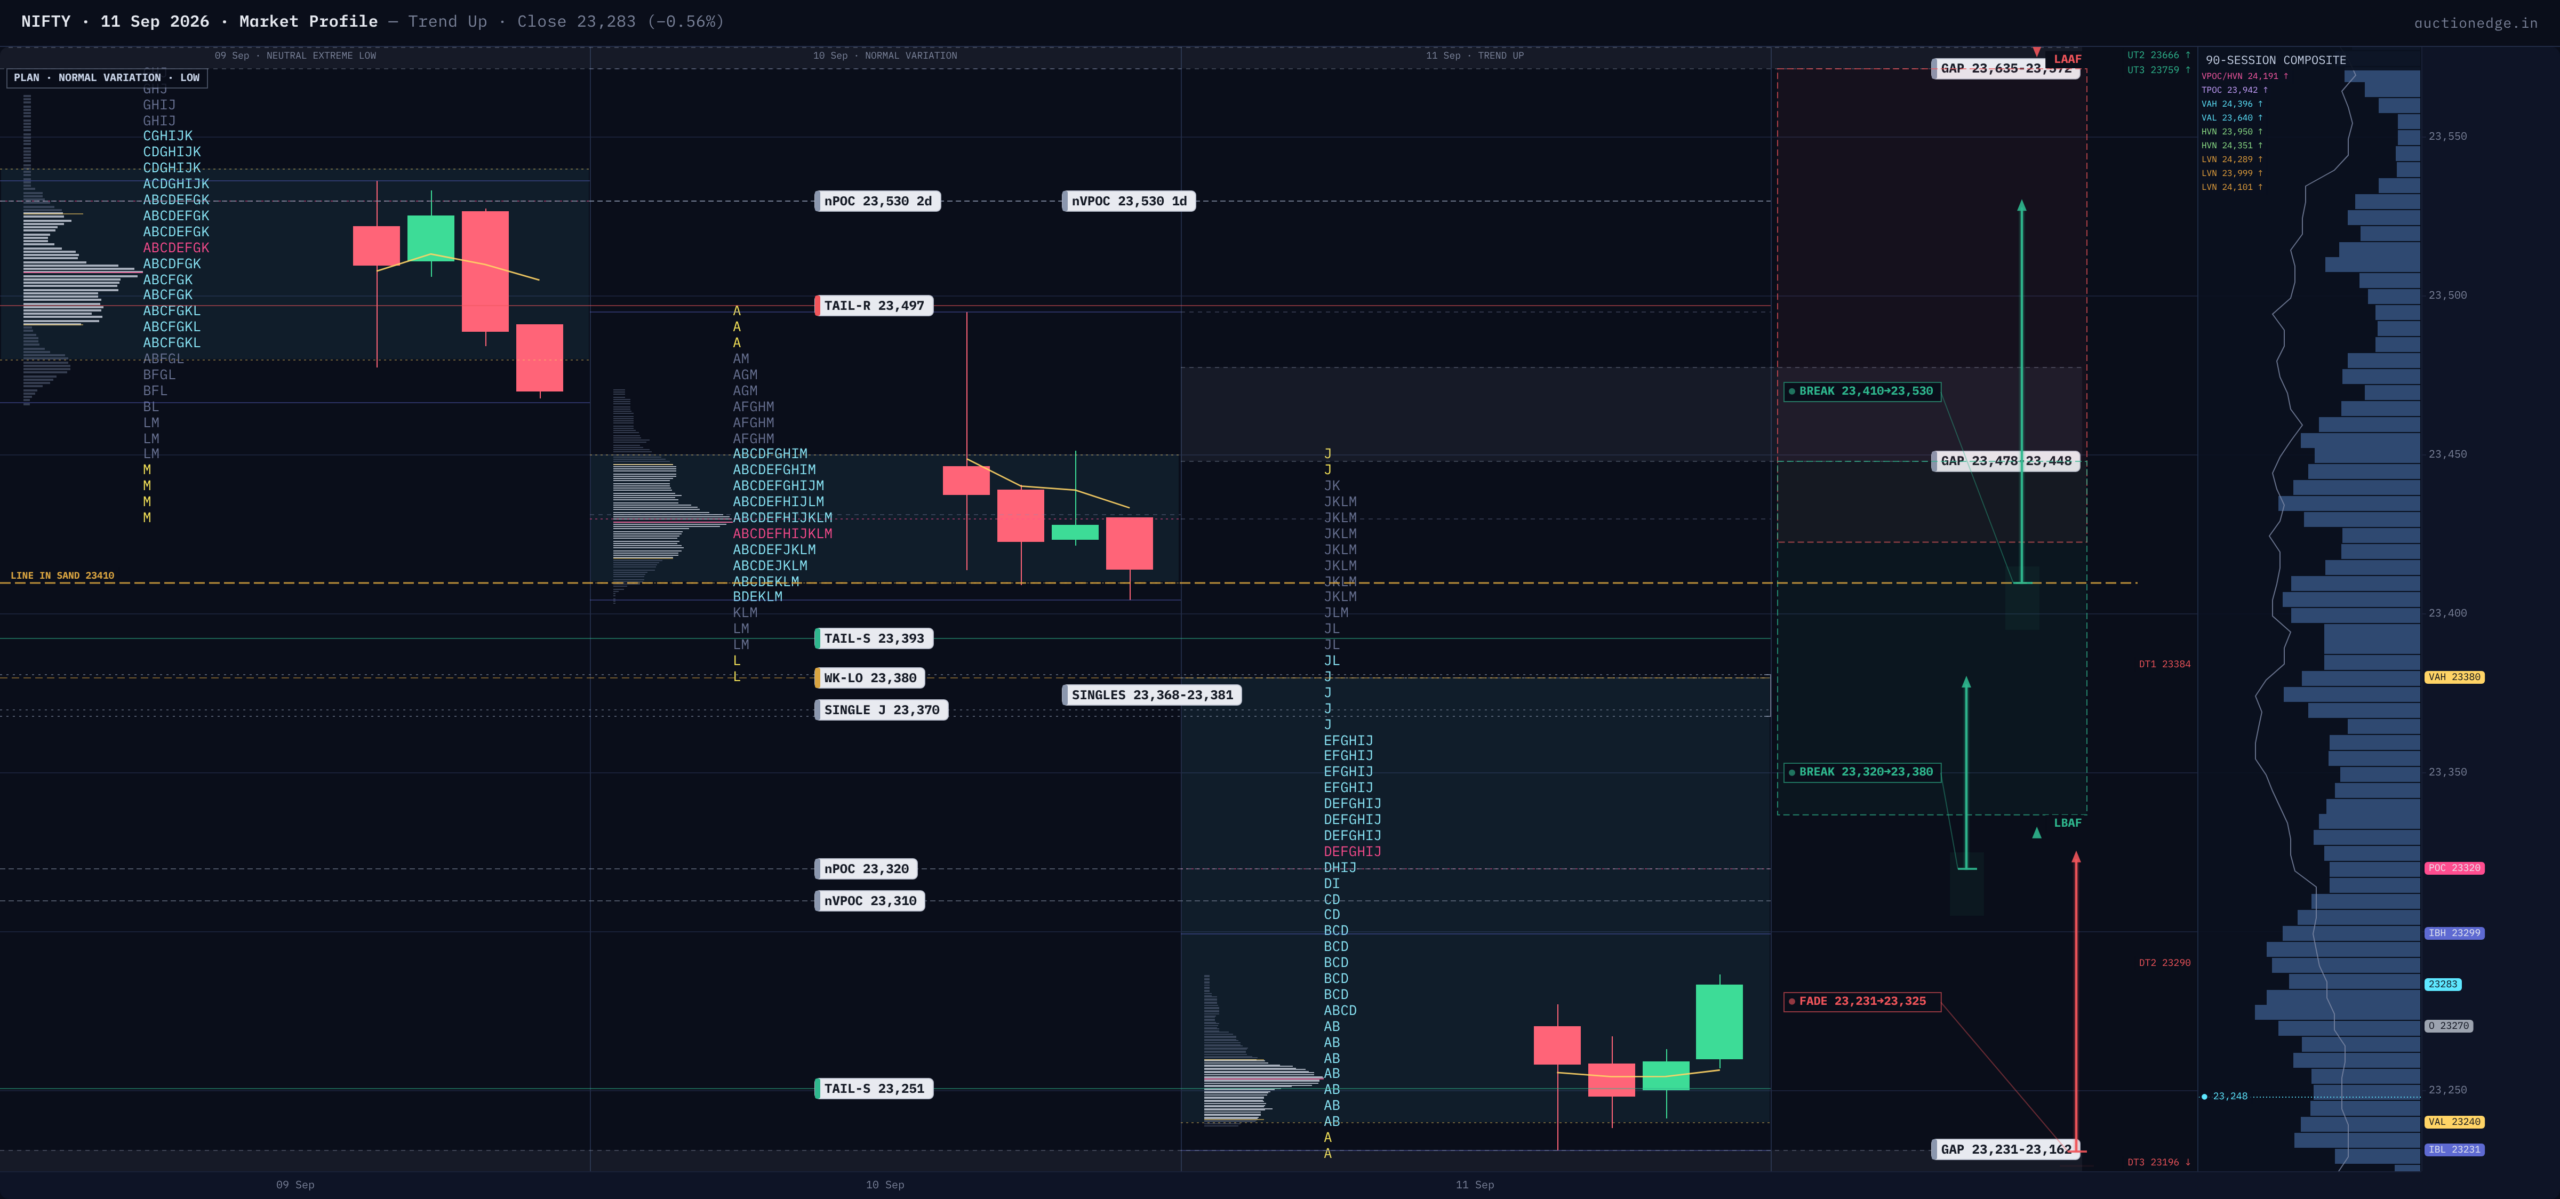
Today complicated that picture. Price gapped down 208 points (0.9%), opening well outside yesterday’s range, then made its low almost immediately with a small buying tail (prices buyers refused to sell into) that held the rest of the day. Buyers took firm control early — the opening hour’s range broke upward in the very next half-hour period, real conviction rather than a late push — and the session printed a thin, elongated trend-day profile into a 23,398 close, 77% up its own range. Neither extreme carried the clean rejection tail of a fully completed auction (poor structure at both ends), leaving both as candidates for a later revisit. This read as initiative buying, not exhausted short-covering: the close held above today’s own fair-value price (point of control near 23,320) and above the whole newly-formed value area (23,240-23,380). Yet value migrated lower for a fourth straight session, sitting entirely beneath yesterday’s (23,410-23,450) with no overlap. The anchored session VWAPs — the cleanest read of where real volume transacted — stay stacked bearishly: today’s (~23,398) below yesterday’s (~23,512), below the day before’s (~23,605) and the week’s average (~23,620). Day-timeframe buyers won today’s fight; the other-timeframe battle for value is still being lost.
Volatility Regime
Implied volatility has cooled from high to normal over three sessions but is ticking back up, and today’s 217-point range ran 1.4x the five-day average — real expansion, though still just a 0.85-sigma move. Two gauges diverge: intraday rotations ran ~42% hotter than options pricing implies (favors chop over fading breakouts), even as realized close-to-close volatility stays well under implied — turbulence round-tripping, not compounding into trend. Standard levels should hold.
Balance Area & Structural Zones
Price sits outside every short-term balance floor — the nearest, a 19-day July shelf, begins near 23,606 — and has already cleared the 3x downside extension (~23,418) off the balance that broke September 3-4. A larger, 26-day balance broke down at yesterday’s close; its targets (22,528 / 21,780) stay in reserve if the slide resumes. Overhead, the key cluster sits 23,448-23,623: the floor of yesterday’s unfilled selling tail, two naked points of control from Wednesday and Thursday, and the weekly VWAP stack together — the heaviest resistance on the board, almost exactly where today’s rally stalled. Below, two freshly naked points of control (23,310, 23,320, both from today) sit just under the close as first magnets on a pullback, backed by today’s buying tail near 23,231.
Historical Statistics
The broader stats lean bullish, but weakly — five of seven relevant queries favor continuation, none with real edge (all under 1.0). The strongest, a close in the top quartile (n=523), split 53%/35% up/down; Fridays after a trend-up day (n=29) split 55%/31%. A lean, not a signal. More pointed: the closest match to today’s exact fingerprint — normal volatility, trend-up day, this open type (n=19) — skews the other way, 47% down versus 37% up next session, with a long-liquidation break the most common follow-through. The two datasets disagree — that disagreement is itself the honest read.
Opening Playbook
Inside value (23,240-23,380): Fade the edges — naked points of control (23,310-23,320) are the first magnet on a dip, 23,380 the ceiling. Contained, rotational session unless an edge breaks with volume.
Outside value, inside range: A retest of the thin 23,231-23,240 pocket lands on today’s buying tail — low confidence given the sliver, but holding it keeps the reversal intact. Testing 23,380-23,448, price probes yesterday’s value low (23,410) and the base of yesterday’s selling tail (23,448); reclaiming 23,410 opens a push at that supply, failing it hands the session back to sellers.
Below range (<23,231): A full gap down resumes the dominant trend, with today’s unfilled opening gap (to 23,270) the first magnet, then the mid-August balance’s 3x extension near 23,325. Trade with the gap; stop back above 23,270.
Above range (>23,448): TRAP WARNING — a gap up runs into the 23,448-23,623 confluence of yesterday’s tail, two naked POCs, and the weekly VWAP. Without acceptance (2+ periods) through that band, this reads as a fade back toward 23,320, not a breakout to chase.
Line in the Sand & Key Levels
LINE IN THE SAND: 23,410 (yesterday’s value low). Above it, the bounce can stretch to test the 23,530 supply cluster. Below it, the downtrend — death cross, bear-stacked VWAPs, a freshly broken 26-day balance — stays the higher-probability path, toward 23,320 and the 23,325 extension beneath it.
- 23,530 | Naked POC cluster | Heaviest resistance: two POCs plus a tail base
- 23,448 | Selling tail base | Where today’s rally already stalled once
- 23,410 | Prior value low | Line in the sand
- 23,380 | Today’s value high | Today’s own value ceiling
- 23,320 / 23,310 | Naked POC / volume POC | First support magnets
- 23,231 | Initial-balance low / buying tail | Structural floor of today’s reversal
Session Learning Note
A strong reversal day inside a still-intact downtrend is not automatically a new trend — it’s a test. Today confirmed buyers can win a session; tomorrow has to confirm they can win back value, not just one day’s range.