EXECUTIVE SUMMARY
- The bigger backdrop stays firmly bearish — four straight weeks of lower value, a fully bearish moving-average and VWAP stack, and price still under the week-to-date anchored VWAP near 23694.
- Today opened, spiked to the session high in the first five minutes, was rejected hard, slid to a fresh low near 23380 by afternoon, then clawed most of it back into a close near 23478.
- Today’s own point of control at 23430 is the line in the sand for tomorrow — hold it and the tape leans toward retesting the 23530 supply cluster; lose it and 23380, then a shelf near 23320, come back into play.
MACRO CONTEXT
The composite market read stays deep in Strong-Bear territory: the rolling VWAP backdrop, a bearish long-term moving-average crossover, and the shorter-dated session-anchored VWAPs all point the same way, with today’s VWAP below yesterday’s and yesterday’s below the day before. The weekly chart has one-timeframed lower for four straight weeks, and each of the last four daily value areas (the zone holding roughly 70% of a session’s trade) has printed lower than the last. Price still sits in the lower half of a multi-year range anchored near 24220 — this weakness is unfolding inside a much larger, unresolved range, not a break into new territory.
The Session: A Rejected Spike, Then a Recovery
The real story happened in the first five minutes. The open near 23447 thrust immediately to 23495 — the session high all day — and was firmly rejected: an Open-Rejection-Reverse, where an early push gets turned back and the market reverses through its own opening levels. Sellers took over, the Initial Balance (the first hour’s range, 23404–23495) gave way, and the slide continued to a low of 23380 — a level that sits almost exactly on the measured-move target left by a small two-day balance area that broke down earlier this week. Tagging that target is a meaningful tell: the obvious nearby downside objective now looks spent. A modest buying tail (a quick rejection of lower prices) in the 23380–23416 zone marked a floor, and the final hours produced a real recovery — the close landed at 23478, above today’s value and only 17 points off the high.
That recovery sits in tension with the structure. Today’s value area (23410–23450) printed fully below yesterday’s (23480–23540) for a second day — value keeps migrating lower even as the close firmed up. There’s also a 100-point split between where the heaviest volume traded (23530, an exact echo of yesterday’s time-based point of control) and where the market spent the most time (23430) — money and time disagreeing, with the close parked in between. The breakdown came late too: the Initial Balance held through midday and only failed for good in the final ninety minutes — hesitant, late-arriving selling rather than the early conviction of a true trend day.
Volatility & Positioning
Today’s 115-point range ran below the 5- and 20-day averages (0.88x recent norm) — a quiet, 0.5-standard-deviation session. Implied volatility has held flat for two sessions in the “normal” bracket and looks fairly priced against realized volatility, though realized moves have quietly been accelerating. Intraday swings are running in line with options pricing — no coiled-spring signal, though rotations have lately been outrunning that pricing, hinting options may be a touch cheap. Standard levels should behave normally tomorrow.
Balance Area Context
The nearest live multi-week balance floor sits far overhead near 23936, ~460 points above the close — not a near-term factor. Worth flagging: a small two-day balance that broke down this week carried a downside target near 23417.6, and today’s low of 23380 already tagged and slightly overshot it — that objective looks spent for now.
Structural Zones
Two levels matter most. Overhead, 23530 is genuine confluence — yesterday’s point of control and today’s volume point of control on the same price — backed by an unfilled gap at 23522–23623 just above it. Below, the 23380–23416 buying tail is the first defense, with a thin shelf near 23320 (a small June buying tail) next if that fails. A naked point of control (a prior session’s heaviest-volume price never revisited) near 23610 is a longer-reach upside magnet.
Historical Statistics
Across fifty similar historical sessions, the next session split roughly 50% higher, 40% lower, 10% flat, averaging a 200-point range — a soft lean higher. The closest-matching 69-session cohort nudges that to about 54/41 higher. Every edge score sits under 1.0, so this is a lean worth noting, not trading alone.
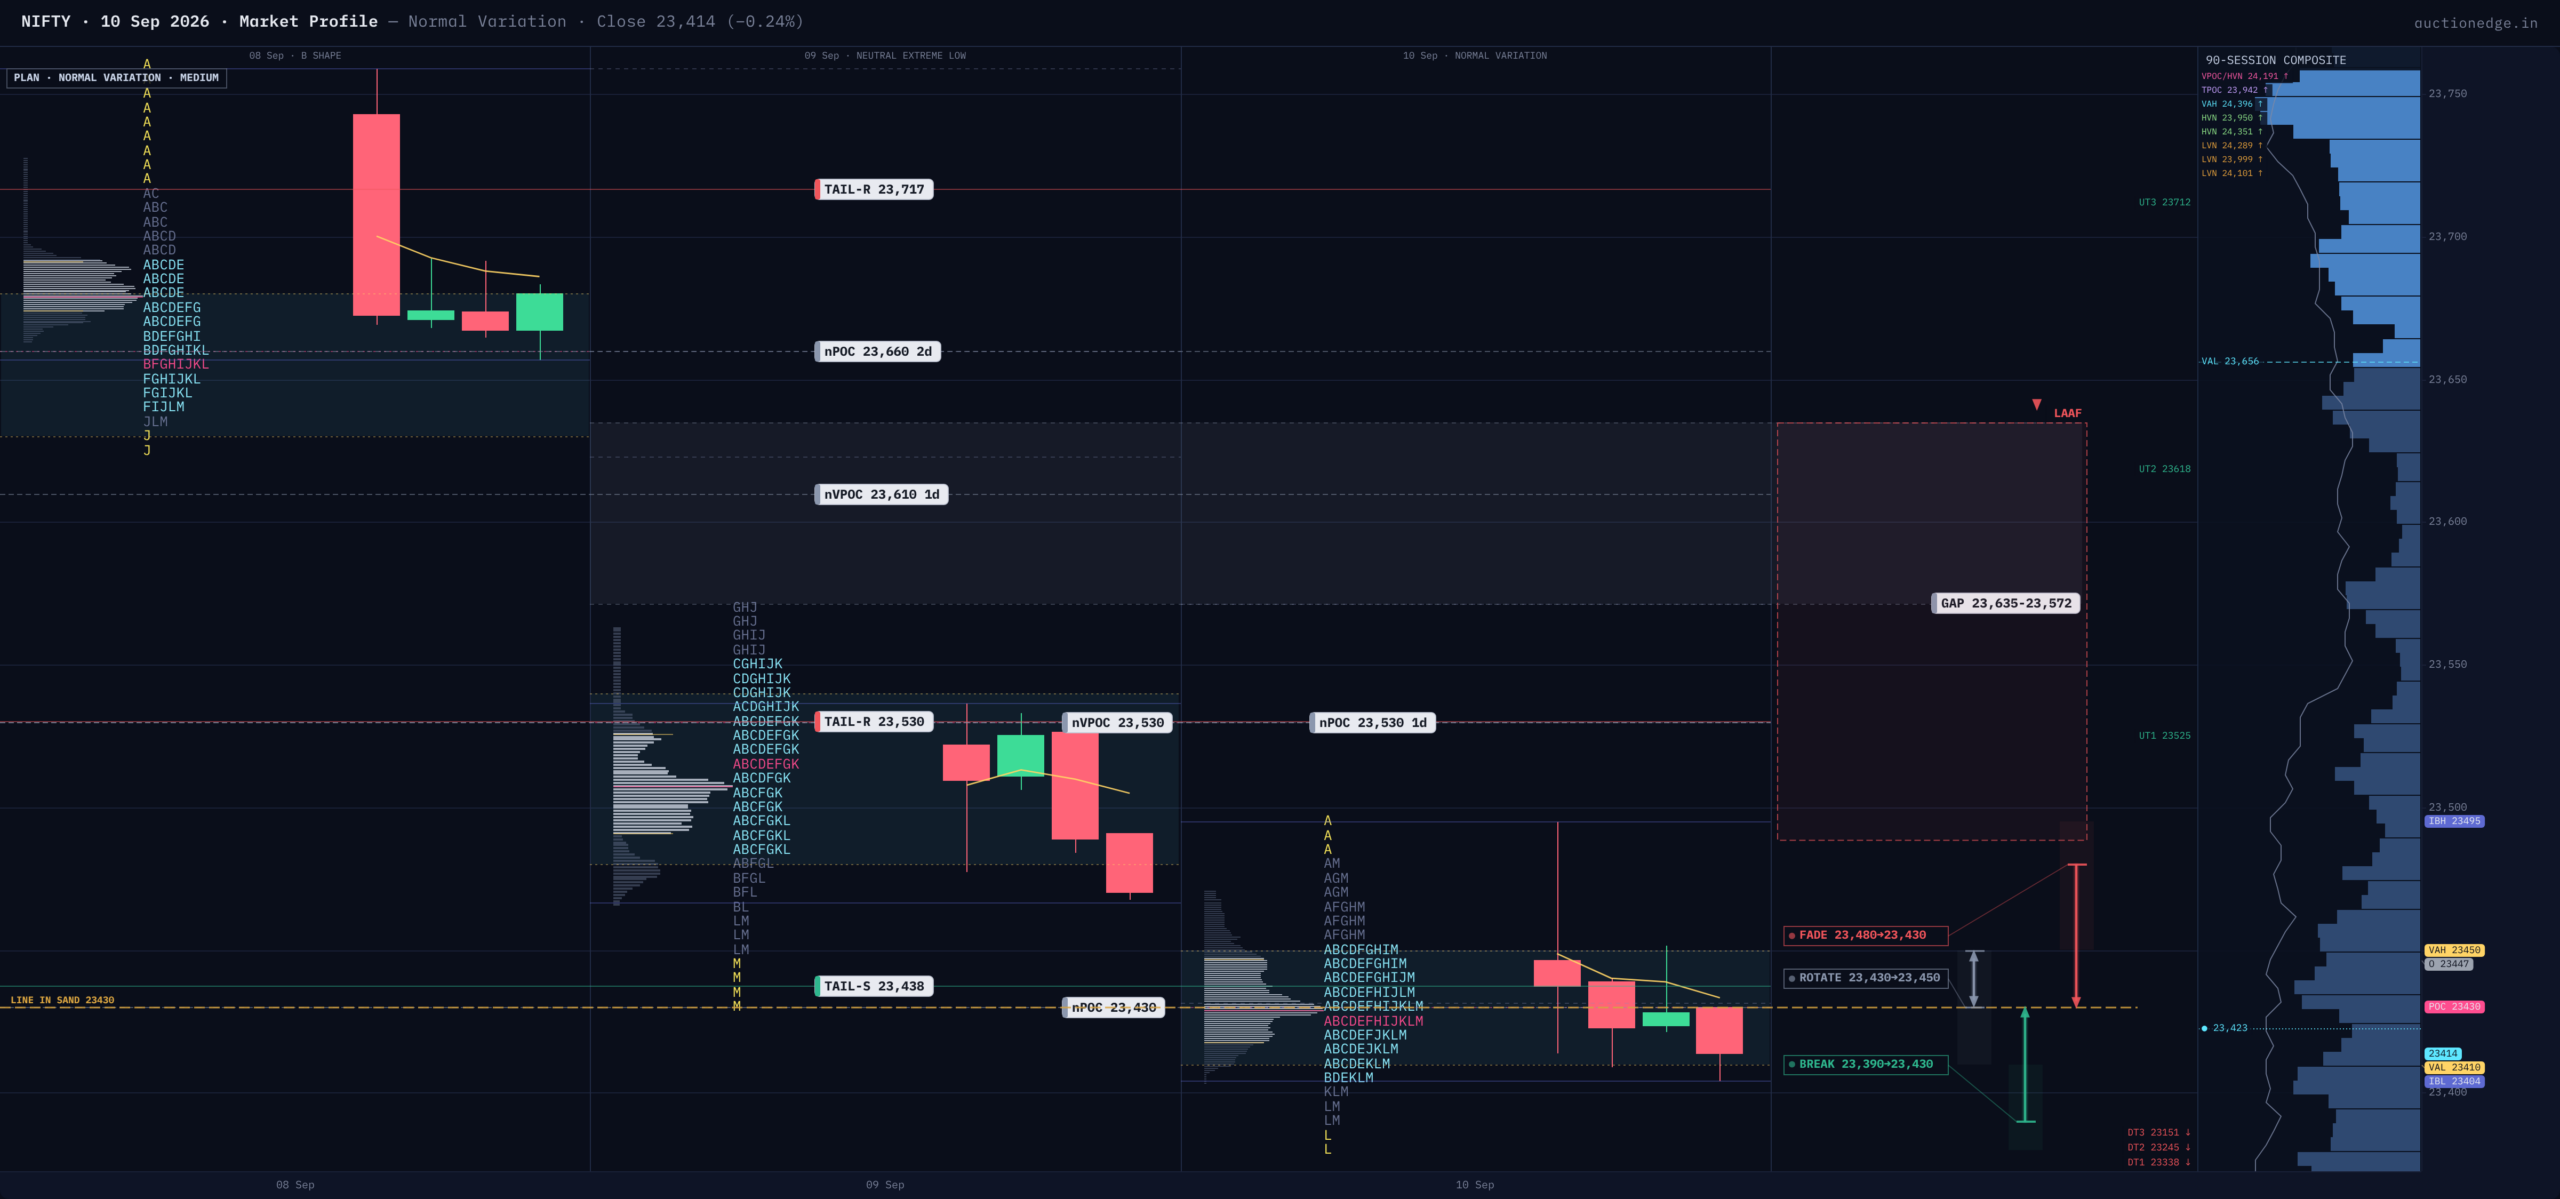
Opening Playbook
Inside value (23410–23450): sentiment unchanged — two-way rotation with 23430 as the magnet; fade edges rather than chase.
23380–23410 (outside value, inside range): sits on today’s buying tail and the now-spent downside target — favor a responsive long toward 23430, stop below 23370.
23450–23495 (outside value, inside range): the shelf where today’s spike was rejected — favor fading toward 23430, stop above 23500.
Gap below 23380: fully out of balance. First shelf underneath is a partially filled gap (23327–23380) and the June buying-tail cluster near 23320. Trap Warning: support sits close enough that a weak gap-down risks a snapback, not a clean trend — a reclaim of 23417 kills the breakdown case.
Gap above 23495: runs into the unfilled gap at 23522–23623 and yesterday’s partially filled selling tail (23495–23572). Trap Warning: dense overhead supply for a first attempt — trust continuation only above 23572; otherwise fade a poke into the low-23500s back toward 23430.
Line in the Sand & Key Levels
LINE IN THE SAND: 23430. Above it, the tape defends today’s value and leans toward the 23530 magnet. Below it, value gives way and 23380, then 23320, become the objectives.
KEY LEVELS (high to low):
– 23610 | Naked POC | Untouched prior volume high, longer-reach magnet
– 23530 | POC / Naked POC | Yesterday’s and today’s heaviest-volume price
– 23495 | Day High / IB High | Where the opening spike was rejected
– 23450 | Value Area High | Top of today’s value
– 23430 | Point of Control | Line in the sand
– 23410 | Value Area Low | Bottom of today’s value
– 23380 | Session Low | Downside extension target tagged here
– 23320 | Buying Tail | June support shelf, next stop below today’s low
Session Learning Note
A spike at the open doesn’t have to define the day — the session printed its high in the first five minutes, spent most of the day unwinding it, and still found enough buying near a well-flagged downside target to claw most of the damage back by the close. Let the tape confirm who wins the last hour; an early extreme is only the opening move, not the verdict.