For three sessions running, value has stepped lower without a single day of overlap — and today didn’t just continue that slide, it closed exactly on the low. The question now is whether sellers still have room to run, or whether the auction has finally arrived somewhere worth defending.
EXECUTIVE SUMMARY
- The weekly tape has one-timeframed lower (each week’s high and low below the last) for a fourth straight week, and every VWAP measure plus the moving-average stack stay aligned bearish.
- Today closed a Neutral day at the extreme low of its range — a third straight non-overlapping step lower in value — but the decline landed almost exactly on an old, untouched volume level and inside a cluster of downside targets left behind by four already-broken short-term balances.
- Tomorrow’s primary scenario favors continued, choppier weakness unless 23540 is reclaimed, with the 23417-23481 confluence the first real test of whether sellers still have conviction — Line in the Sand: 23540.
MACRO CONTEXT
The weekly chart has now one-timeframed lower for four straight weeks, and the rolling VWAP stack, the moving-average stack, and the 50/200-day cross all sit at their most bearish setting, with barely more than a quarter of NSE names holding above their own 50-day average. Price sits within the broad two-year balance area, roughly a third of the way up from its low — structurally weak, but not historic. Today traded entirely in keeping with that backdrop, deepening a slide now three sessions old.
The Day: A Late Flush, and an Old Floor
Today opened with a gap down of roughly 113 points, tested higher around midday — the session’s only real push beyond the Initial Balance (the first hour’s range, roughly 23467-23537) — then chopped for two hours before breaking down hard in the final hour into a close that landed exactly on the day’s low. That timing matters: a break at the open signals conviction from the bell; one confined to the last hour looks more like day-timeframe positioning unwinding into the close than a fresh seller taking control from the start. Because range extended on both sides of the Initial Balance, this is structurally a Neutral day — but an extreme close at the bottom of the range is one of the more reliable next-day continuation signals here, and value confirms the seller’s case regardless: today’s fair-price zone (the area holding ~70% of the day’s trade, 23480-23540) sits entirely below yesterday’s (23630-23680), a third consecutive non-overlapping step lower. One flag worth respecting: the heaviest volume printed near 23610, well above where the market actually spent most of its time (~23530) and further above the close — volume trapped overhead, the kind of liquidity that often fuels further downside as those positions get stopped out. Today’s high (23571.55) also lacks any real rejection — an unfinished top (a “poor high”) the market will likely test again eventually, even if not tomorrow.
Where this gets interesting is what greeted the decline on the way down. The close landed within two points of a volume level from mid-June untouched for 89 sessions, and inside a tight band — roughly 23417 to 23481 — where four separate short-term balances broken in recent weeks all point their algorithmic downside extension targets. That is unusual structural agreement for a 64-point stretch, arguing for at least a pause here even though nothing about the broader trend has changed; price is also already trading beneath the low of both nearby multi-week balance areas (23606 and 24026) without either confirmed broken yet, worth watching for a formal flip. Volatility stayed unremarkable by contrast: today’s range was almost exactly average for both the week and the month, intraday rotation is running right in line with options pricing, and standard levels hold at face value rather than needing to be stretched — though today’s move still registered as a rare, roughly 2.2-sigma print, a reminder a quiet range can still produce a statistically unusual result when the day never looks back after the open. The most heavily-weighted historical read available (n=19, the top edge score of the seven considered) actually favors further downside two-to-one after this exact Wednesday setup; a thinner, five-instance match on today’s broader fingerprint leans mildly higher, but on far too small a sample to act on.
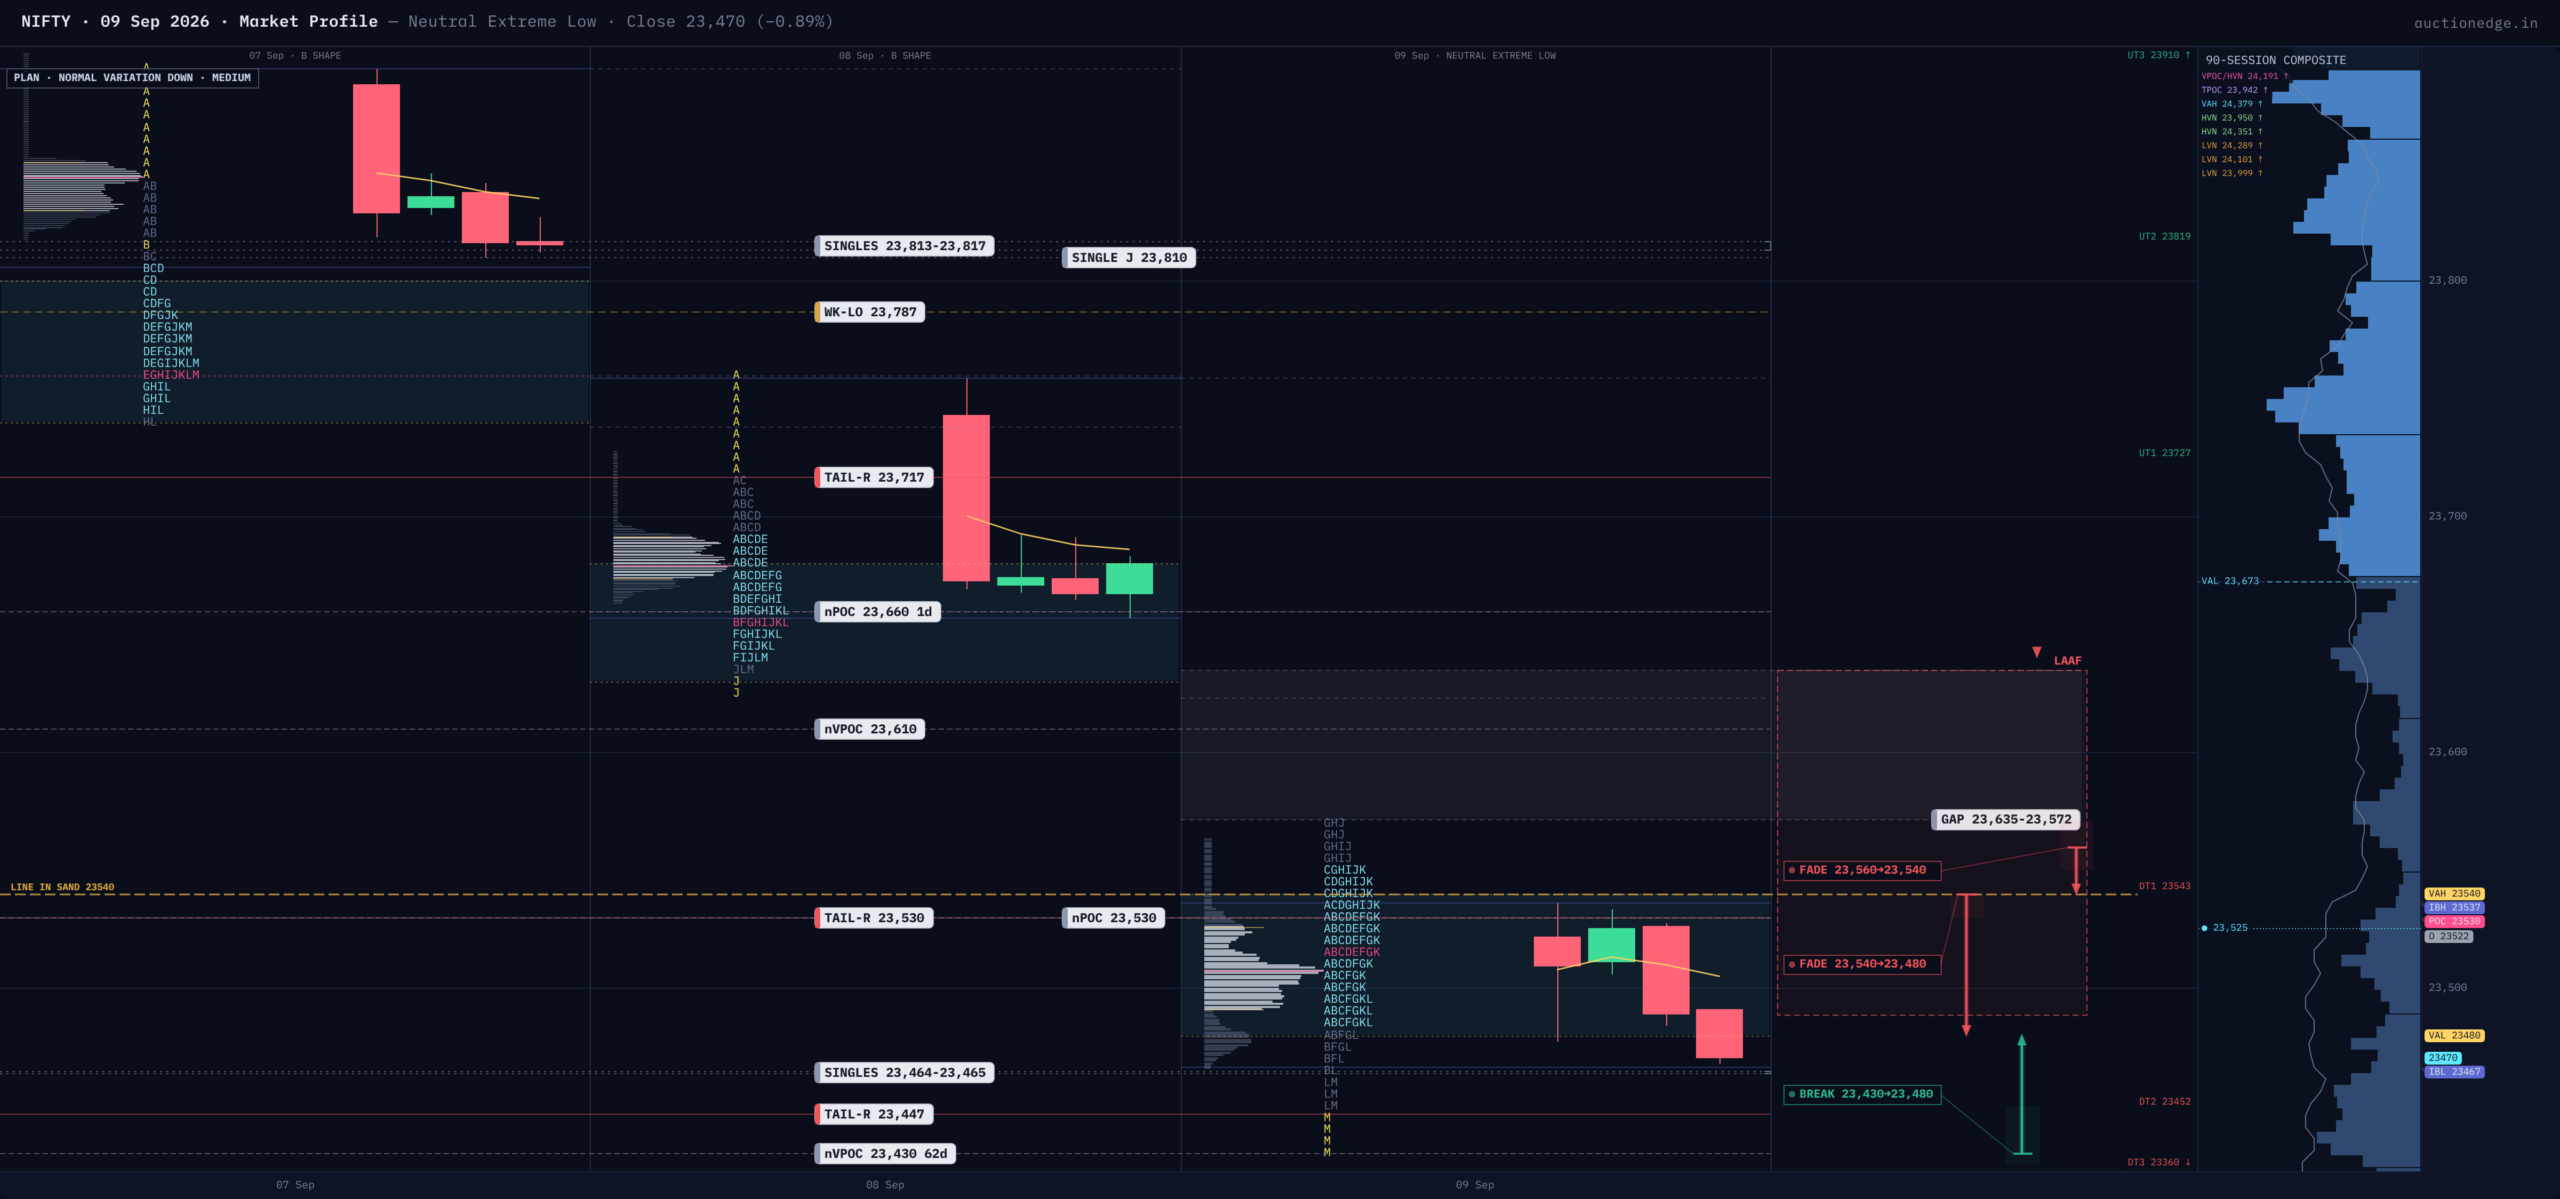
Opening Playbook
Inside value (23480-23540): two-sided rotation, fade the edges. Below value but inside range (23431-23480): overlaps the naked volume level and today’s small buying tail — treat a hold as the confluence being tested, watch for a bounce toward value. Above value but inside range (23540-23572): sits entirely inside today’s own unfilled gap — fade unless price is accepted through 23623. Below the range (under 23431.5): sellers get the benefit of the doubt toward the deeper naked-POC cluster near 23360, where an old volume level and the options market’s nearest hedging pivot (where dealer gamma flips sign) sit almost on top of each other. Above the range (over 23571.55): Trap Warning — runs straight into today’s own unfilled gap and, just above it, yesterday’s untouched value (23630-23680); fade unless price holds above 23660.
Line in the Sand & Key Levels
Above 23540, the market reclaims today’s value and the recent slide loses its immediate conviction. Below 23540, sellers keep the more probable path toward the 23417-23481 confluence and, if that fails to hold, the deeper naked-POC/gamma-flip cluster near 23360.
Key Levels (high to low): 23623 (top of today’s unfilled gap) | 23540 (VAH — Line in the Sand) | 23530 (today’s POC) | 23480 (VAL) | 23464-23465 (today’s single print) | 23431-23462 (today’s buying tail) | 23430 (naked volume POC, untouched 89 sessions) | 23417-23481 (broken-balance measured-move cluster) | 23360 (naked TPO POC / gamma-flip confluence).
Session Learning Note
An extreme close at the exact low is one of the strongest next-day continuation signals in this framework, but today is a reminder that timing matters almost as much as direction: a breakdown that arrives only in the last hour of trade, and lands straight inside a dense cluster of old structural levels, deserves a more measured reaction than the same breakdown happening at the open. The rule didn’t fail today — it just found somewhere worth stopping to check.