For two sessions the tape has broken down early and never recovered. The question is whether this is the tail end of long liquidation or a fresh leg lower — a close in the bottom tenth of today’s range leaned toward the latter.
EXECUTIVE SUMMARY
- The weekly tape remains one-timeframing lower and every anchored and rolling VWAP measure — today’s session VWAP printed below both of the prior two sessions’ — stayed aligned bearish.
- Today closed a second straight B-Shape day whose value shifted lower again with zero overlap to yesterday’s, and a close in the bottom 9% of the range confirms sellers, not just profit-takers, still control the tape.
- Tomorrow’s primary scenario favors cautious continuation lower while 23680 caps the market, with a just-broken short-term balance’s measured-move targets near 23570 now in play — Line in the Sand: 23680.
MACRO CONTEXT
The weekly chart has been one-timeframing lower for four straight weeks, and the rolling VWAP stack, the EMA stack, and the 50/200-day moving-average cross are all aligned bearish, with the composite market read sitting at its most bearish setting. Zooming out, price still sits inside the broader multi-week balance area running back to mid-July, and barely a quarter of NSE names trade above their own 50-day average — this reads as broad market weakness, not just an index quirk. Today’s session traded entirely in sympathy with that backdrop.
The Day: A Second Liquidation Leg
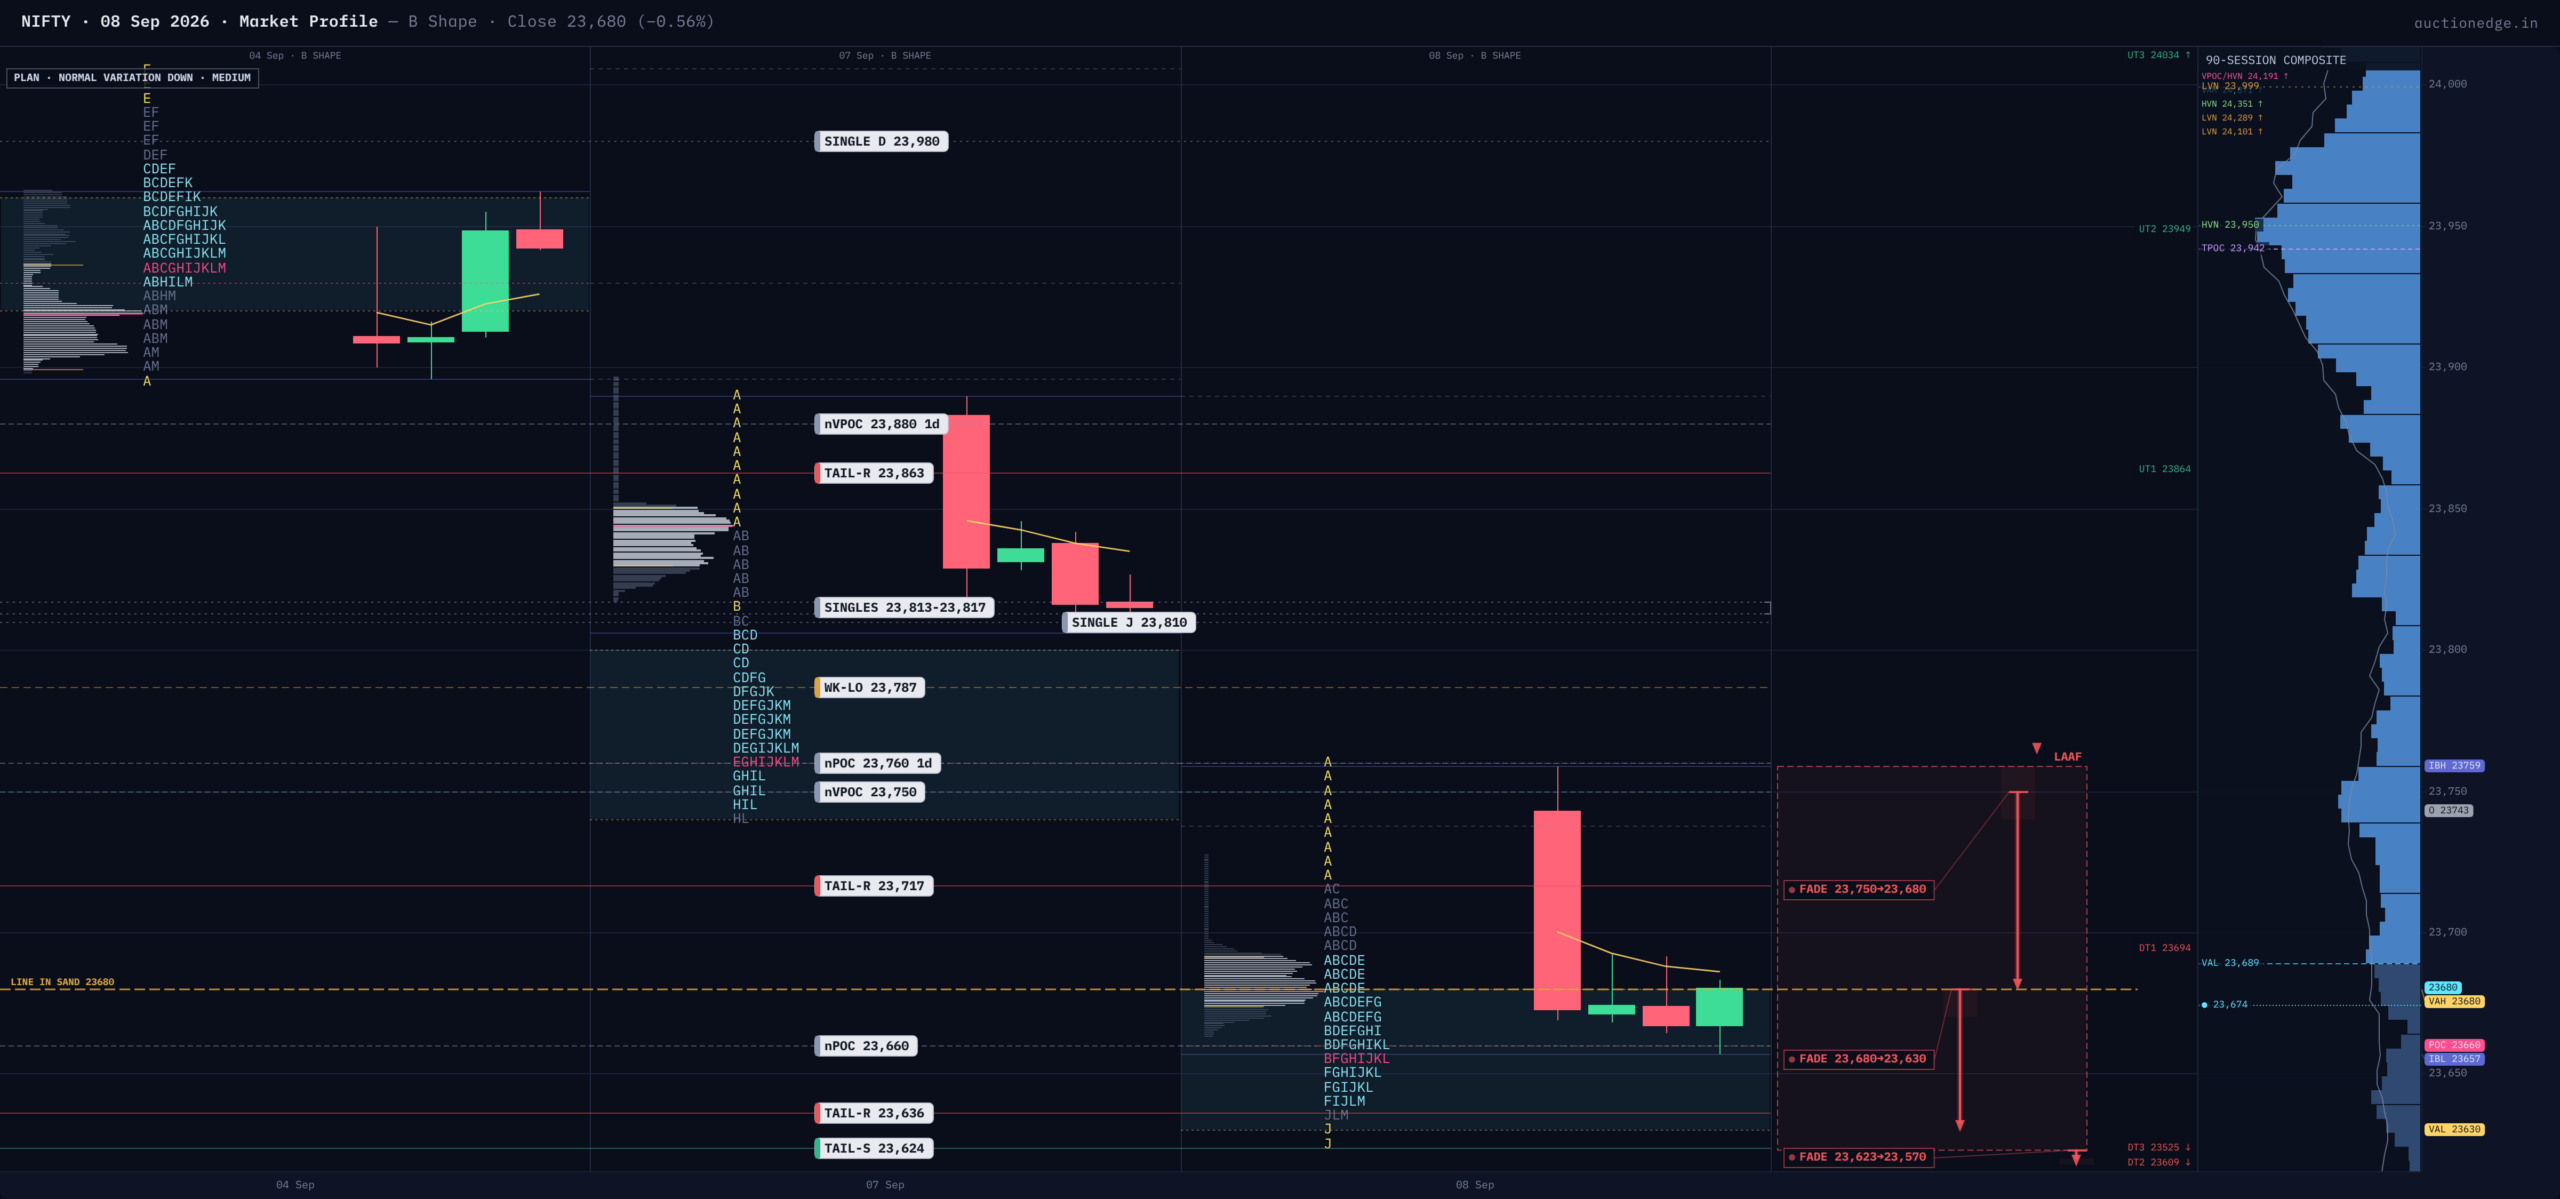
Today opened with an Open-Drive to the downside — the most convinced kind of open, where a longer-horizon (other-timeframe, or OTF) participant has already decided direction before the bell and price never trades back through the opening range. That conviction showed early: the Initial Balance (the first hour’s range, roughly 23657-23759) gave way to the downside inside the first two-and-a-half hours, and by the close the session had built the same lower-heavy, thin-topped shape as yesterday — a B-Shape, a long-liquidation break rather than fresh initiative selling. Value confirms who won: today’s value area (the zone holding about 70% of the day’s trade, 23630-23680) sits entirely beneath yesterday’s (23740-23800), with the volume-based measure stepping down the same way — time and volume agree, for a second session running. One wrinkle: the heaviest volume printed up near 23750, well above where price settled, while the market spent most of its time lower near 23660 — volume trapped above price, business done at levels the tape has since abandoned, which typically fuels further downside as those positions get stopped out. A close just five points above the value low, in the bottom 9% of the day’s range, leaves little doubt who controlled the final hour.
Volatility flipped hard alongside it: implied volatility jumped from Normal to its most extreme bracket in a single session, even as today’s own range (136 points) came in slightly under the 20-day average true range (162) and intraday swings ran only about half of what that implies — a rubber band still coiled, not sprung — so today’s levels carry low reliability, arguing for stops and targets roughly a third wider than usual.
Price remains inside the broad 19-day balance running from mid-July, but the tighter two-day balance built September 3-4 broke down today and closed exactly at its own break price, putting that bracket’s measured-move targets — roughly 23570 and 23417 — into play if the slide continues.
Overhead, today’s own selling tail (23674-23759) stacks with yesterday’s still-untouched fair-price level at 23760 and, further up, yesterday’s unfilled opening gap (23883-23896) and selling tail (23836-23890) — a real confluence shelf needing genuine acceptance to clear. Below, a buying tail formed right at today’s low (23623-23649) and a partially filled one from late July (23606-23623) offer the first cushion, with today’s own untouched points of control (23660 and 23750) open as magnets either way.
The historical record offers no decisive edge: the best signal is a weak lean toward a bounce (57% up after this day-of-week/day-type pairing, n=21, edge 0.71), while a thinner three-session match on today’s fingerprint — extreme volatility, B-Shape, Open-Drive-Down — tilted lower two of three times with a wider next-session range. Neither is a basis to lean hard.
Weighing it together, the structural case — a second non-overlapping step lower in value, a bearish VWAP and EMA stack, a short-term balance broken at today’s own close — outweighs a thin, directionless statistical record. The base case is cautious continuation: rallies into the overhead shelf get sold until proven otherwise, while today’s low and the buying tail beneath it are the first place responsive buyers should show. Tomorrow also opens a fresh options cycle after today’s expiry, which historically carries slightly larger rotations than a mid-cycle day — size initial risk accordingly.
Opening Playbook
Five zones. Inside value (23630-23680): fade-the-edges, two-sided trade, with call/put open-interest walls at 23650/23600 reinforcing a pin near today’s point of control (23660). The thin sliver below value but inside range (23623-23630) is really the top of today’s own buying tail — treat as an inside-value open, bounce bias back toward 23680. Above value, inside range (23680-23759): runs into today’s own selling tail and the naked volume point of control at 23750 — fade, don’t chase. Below the range (under 23623): sellers get the benefit of the doubt toward the July buying tail (23606-23623) and the broken balance’s target near 23570, covering on a reclaim above 23660. Above the range (over 23759): Trap Warning — runs immediately into yesterday’s untouched fair-price level at 23760, then the single prints at 23813-23817 and yesterday’s selling tail/gap near 23836-23896; fade back toward value unless price accepts above 23896.
Line in the Sand & Key Levels
Above 23680, the market reclaims today’s value and the two-session slide lower pauses. Below 23680, sellers keep the more probable path toward 23606-23623 and, if that gives way, the broken balance’s targets near 23570 and 23417.
Key Levels (high to low): 23883-23896 (yesterday’s unfilled gap) | 23836-23890 (yesterday’s selling tail) | 23760 (yesterday’s untouched fair-price level) | 23750 (today’s untouched volume POC) | 23680 (VAH — Line in the Sand) | 23660 (today’s POC) | 23650/23600 (call/put OI walls) | 23630 (VAL) | 23623-23649 (today’s buying tail) | 23606-23623 (July buying tail) | ~23570 (broken-balance target).
Session Learning Note
Two B-Shape days in a row is a reminder that long-liquidation breaks aren’t automatically one-and-done. The rule says the bottom should hold once old longs finish covering — but its own exception, an open below the prior day’s value with fresh selling, has now fired twice, resetting the liquidation clock rather than closing it.