The session opened on a modest gap higher, as if sellers had taken the day off — then spent the day proving otherwise, closing exactly on the low with nothing beneath it. Tomorrow’s question: was that close capitulation, or just the opening move of something bigger?
EXECUTIVE SUMMARY
- Weekly value has now printed three straight lower value areas and the market has been one-timeframing lower for a second consecutive week — the bigger trend stays down.
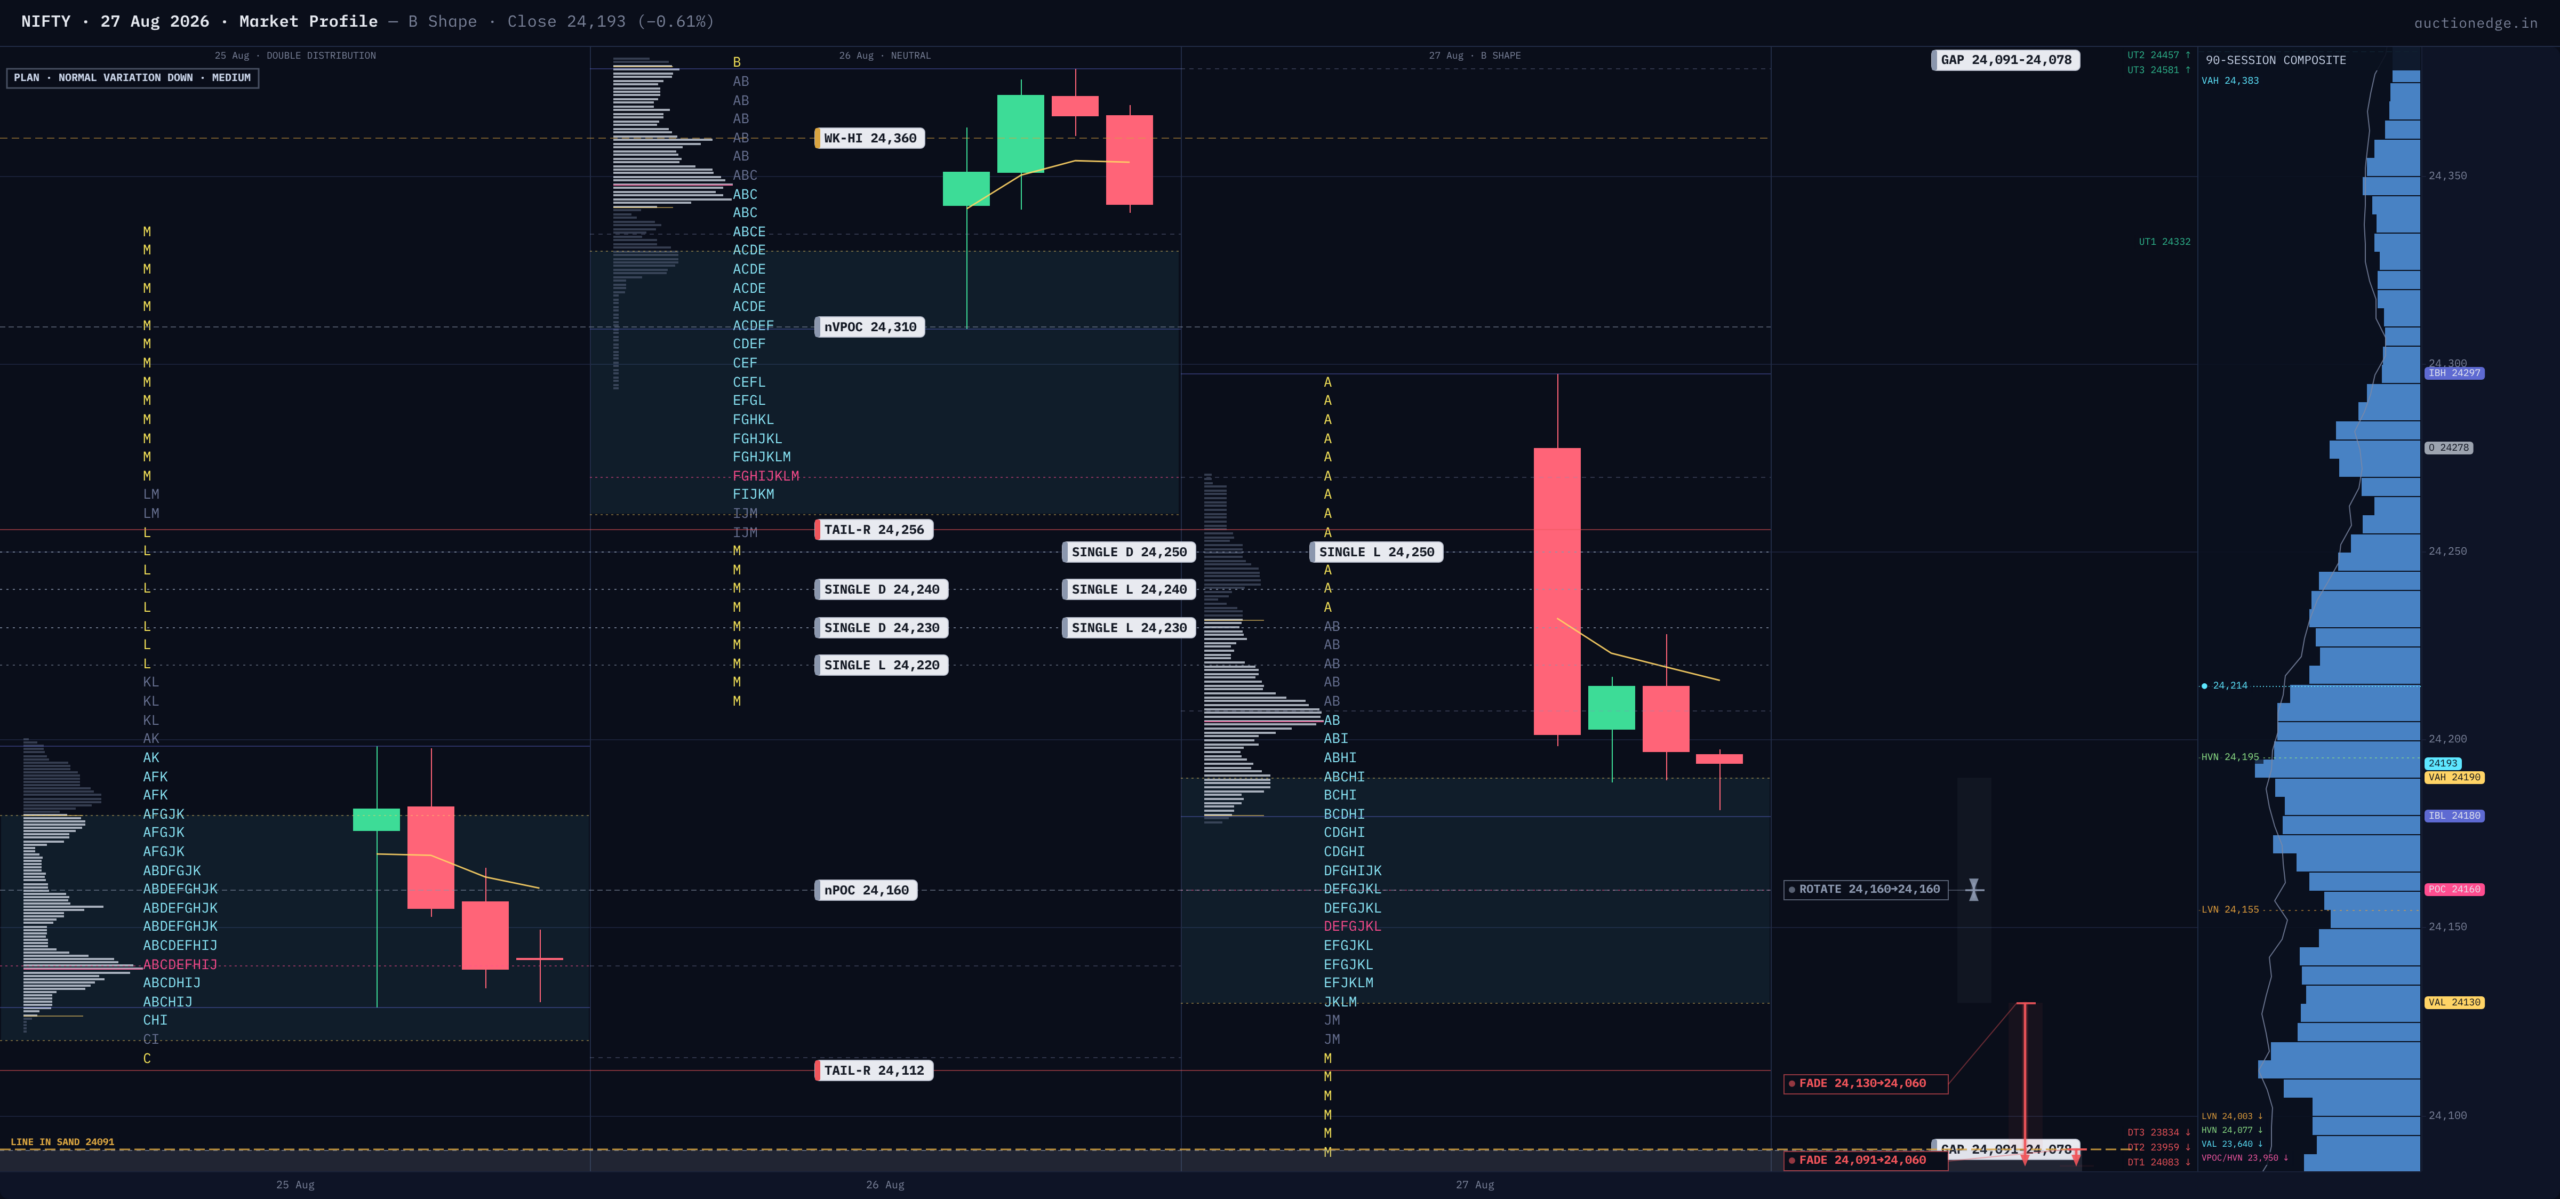
- Today logged a long-liquidation break (a “B-shape” profile) that tested higher first, was rejected, then sold off in a straight line to close at the exact session low with no rejection tail at either extreme.
- Below 24,091-24,130 the bias stays bearish toward the 24,060 magnet and the 24,026-24,052 support shelf; reclaiming 24,130 opens a responsive bounce back toward 24,160-24,190.
MACRO CONTEXT
The bigger picture stays heavy: this week’s value (24,150-24,300) sits below last week’s (24,300-24,500), the third straight session-to-session value-area decline, and the weekly chart has been one-timeframing lower for two weeks running. Price still holds inside the 786-day macro balance, so the multi-year structure isn’t broken — but the composite read (a negative score, a bearish EMA stack, and a moving-average “death cross,” where the shorter-term average crosses below the longer-term one) leans bearish even as breadth stays only mildly negative. Today’s session traded with that backdrop, not against it.
Day Type & Value: Who Controlled the Session
Call it a long-liquidation break with teeth. The open gapped up 70 points, tested marginally higher into 24,297, then found nothing to sustain it — a classic Open-Test-Drive Down, where a failed test at a reference point hands control to the opposite side. The Initial Balance (the first hour’s range, 24,180-24,297) held only briefly: sellers broke below it in the very next half-hour period, an early break arguing for real conviction. From there it was close to one-directional selling into the bell. Value migrated fully beneath yesterday’s — today’s value area (24,130-24,190) sits entirely under yesterday’s (24,260-24,330) — confirming sellers took control. The close landed exactly on the low (0% of the day’s range), a stronger statement than a typical liquidation break usually delivers: a textbook B-shape expects the liquidation to exhaust and buyers to show up near the lows. Today, no buying tail formed beneath the close — an incomplete auction at both ends of the range, tagged explicitly as poor structure. That missing defensive tail is the tell that this may carry more initiative selling than simple long liquidation.
One data point reinforces this: the volume-weighted center of trade (heaviest volume) sat at 24,310, a full 150 points above the time-weighted center (most time spent) at 24,160, with price closed well beneath both — longs trapped above current price, supply that tends to keep feeding a break lower as those positions surrender.
Volatility & Balance Context
IV just stepped up from low to normal over two sessions and today’s range ran 23% above the 5-day average, yet realized volatility is decelerating (5-day below 20-day) and options remain fairly priced — nothing argues for compromised reference levels. On balance, price sits exactly on the floor of its newest short-term balance (24,090.85-24,378.60, value 24,128-24,264), having already broken through the next balance down (broken August 19th at 24,078); a confirmed break of today’s floor triggers that balance’s own targets near 23,515 and 23,228.
Structural Zones for Tomorrow
Overhead, today’s own rejected high (24,214-24,297) is now a selling tail (a zone where aggressive sellers rejected higher prices) — first resistance on any bounce — and above it, three sessions of partially-filled selling tails stack from 24,343 through 24,621, real overhead supply if price gets there. Below, the nearest magnet is a naked point of control (a prior session’s untouched fair-value price) at 24,060, sitting above a buying-tail shelf at 24,026-24,052 and reinforced by an unfilled gap zone at 23,824-23,928 further beneath.
Historical Statistics
The statistical backdrop offers only a modest lean, not a strong edge — confluence is explicitly weak, and even the strongest single factor (after a long-liquidation break, n=23) scores under 1.1 on the edge scale. The closest match to today’s setup (liquidation break plus failed-test-down open, n=15) skews 53% down versus 40% up, average next-day range near 229 points — directionally consistent, but not something to lean on heavily.
Opening Playbook
(1) Open inside today’s value (24,130-24,190): sentiment unchanged, responsive trade — fade toward the 24,160 pivot until the initial balance forms.
(2) Open outside value but in range, below (24,091-24,130): moderate bearish tilt; a rejection back below 24,130 targets the naked POC at 24,060 and the buying-tail shelf at 24,026-24,052.
(3) Open outside value but in range, above (24,190-24,297): expect this to run into today’s own selling tail at 24,214-24,297 — fade toward 24,160 unless it clears with real follow-through.
(4) Open below today’s range (under 24,091): a full gap down, trade with it toward 24,060 — Trap Warning: the buying-tail shelf at 24,026-24,052 and the gap-fill zone near 23,824-23,928 sit close beneath, so a sharp bounce there is a real risk for late shorts.
(5) Open above today’s range (over 24,297): a full gap up runs almost immediately into stacked selling tails from 24,343 to 24,621 — Trap Warning: the clearest trap of the five; treat early strength as vulnerable unless it prints real acceptance above 24,380.
Line in the Sand & Key Levels
LINE IN THE SAND: 24,091. Above it, expect a responsive bounce toward value (24,130-24,190). Below it, the trapped-liquidity thesis plays out toward 24,060 and the 24,026-24,052 shelf.
KEY LEVELS (high to low):
– 24,297 | Today’s tested high / selling tail | First resistance on any bounce
– 24,190 | Today’s Value Area High | Fade-zone upper boundary
– 24,160 | Today’s Time POC (naked) | Time-weighted fair value, now unfilled overhead
– 24,130 | Today’s Value Area Low | Line between balance and breakdown
– 24,091 | Session low / balance floor | Line in the Sand
– 24,060 | Naked POC (Aug 19) | Nearest downside magnet
– 24,026-24,052 | Buying-tail shelf | First real support cluster
Session Learning Note
A B-shape day and a close on the exact low are not the same signal, and today delivered both. When a liquidation break leaves no tail at all beneath the close, don’t default to the textbook “buyers return” script — check whether the volume and time centers of the day agree first. Here they didn’t, and that divergence is doing more work than the day-type label alone suggests.