EXECUTIVE SUMMARY
- Weekly value has drifted lower for two straight weeks and the medium-term moving averages just crossed bearish, yet today’s session pushed price back above every recent VWAP reference and closed near the top of its range.
- Yesterday’s Neutral day closed dead-center with no clear winner; today opened quietly inside yesterday’s territory, tested lower first, then an afternoon buying wave broke away to a fresh six-day high.
- Wednesday’s primary question is whether that afternoon breakout can clear the resistance shelf sitting just 5-25 points overhead, or whether it stalls back into today’s own fair-price zone.
MACRO CONTEXT
The bigger picture is genuinely mixed. The market has been one-timeframing lower on the weekly chart for two consecutive weeks, with the most recently completed week’s fair-price zone (roughly 24150-24300) sitting beneath the week before it (24300-24500). Short-term momentum (the 8- and 21-day averages) still points up, but the 50-day average has just crossed below the 200-day — a longer-term caution flag. Zoomed out further, price remains in the upper half of a 784-day trading range, above that multi-year center of gravity — a market sitting at the seam between a tired weekly downtrend and buyers who keep showing up on dips.
Yesterday was a genuine stalemate — a Neutral day that opened testing higher, gave it back, and closed dead center in its range, neither side securing an edge. That kind of close usually hands the next session a coin-flip open: today opened inside yesterday’s range, traded quietly for the first hour, tested down toward 24115, then an afternoon buying wave took over.
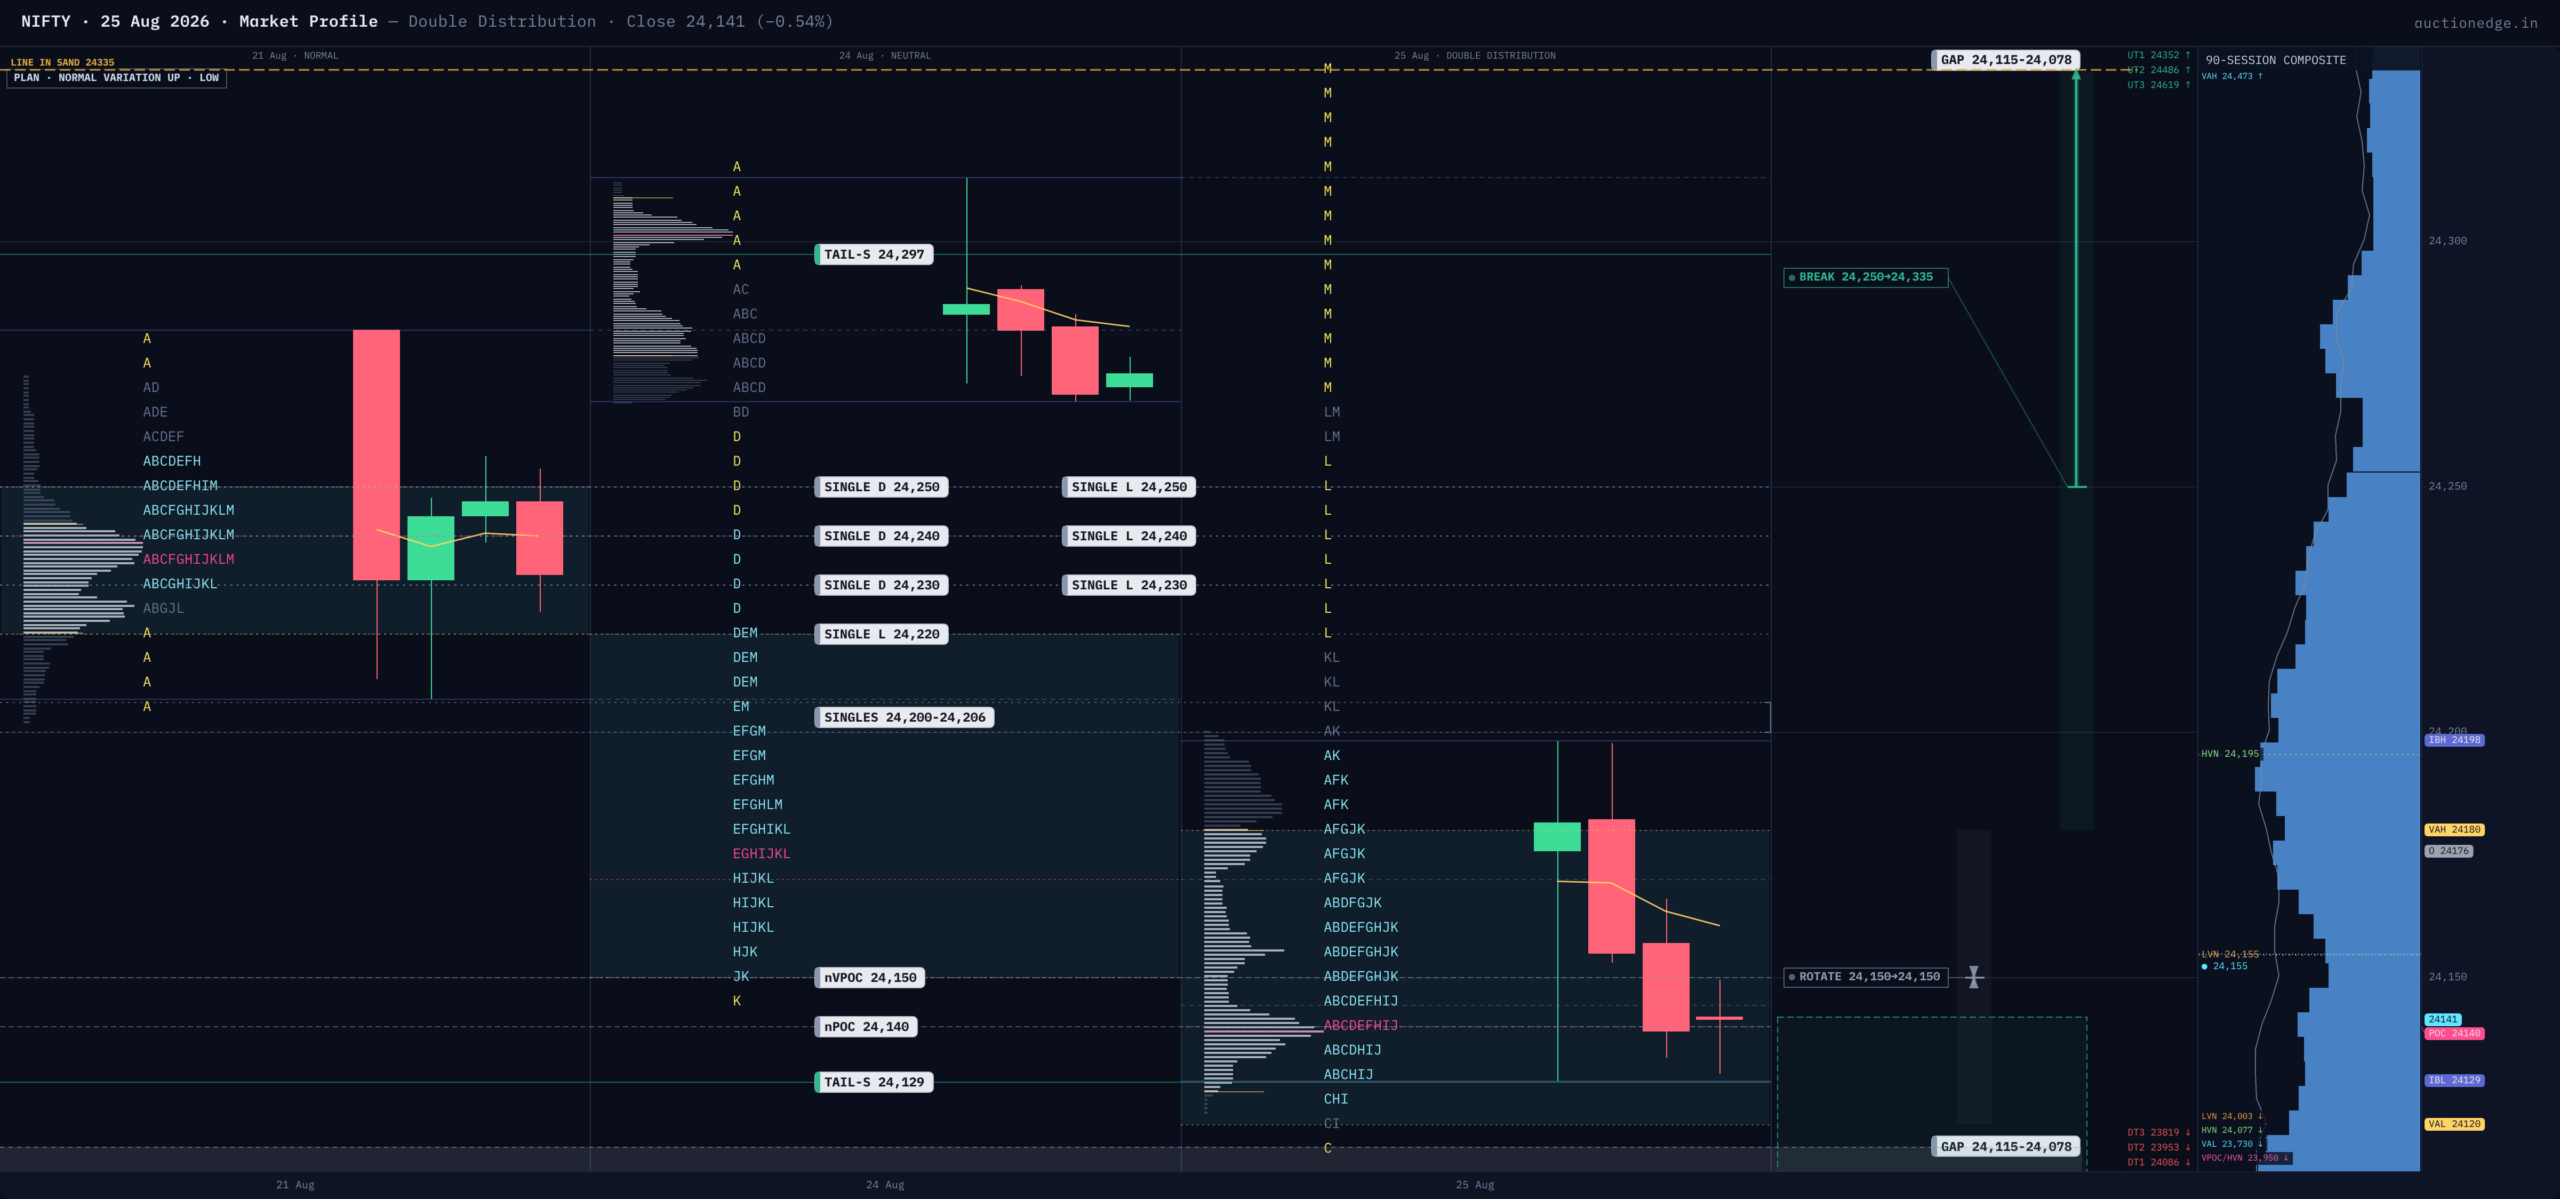
The day that resulted is best described as a Double Distribution day: a narrow opening hour (a 69-point Initial Balance — the first hour’s range — barely 40% of the typical 20-day daily swing) that couldn’t hold, followed by a decisive breakaway to a second, higher distribution late in the session. Structurally this is the classic “coiled spring” setup — a tight early base makes it easier for one side to tip the balance once new business shows up — and that’s what happened: price chopped near 24130-24180 through the morning, then broke away in the final two hours of trade to close at 24334.55, the day’s high.
Here’s the tension worth sitting with: today’s own fair-price zone (the area holding roughly 70% of the day’s trade, 24120-24180) sits slightly below yesterday’s (24150-24220) — continuing the two-week pattern of eroding value. But price finished roughly 155 points above its own value area and above every recent volume-weighted average reference (today’s, yesterday’s, and the week-to-date anchor) — an unusual disconnect between where business was transacted and where the tape wanted to go. The honest read: reactive, responsive trade dominated the bulk of the session, but a late longer-horizon buying push overpowered it into the close. One footprint from that move: a thin, low-volume shelf near 24200-24206 was left behind on the way up — a level with little business done there that should offer cushion on any pullback tomorrow.
On volatility: implied volatility just stepped down from a Normal to a Low regime after one session, even as today’s actual range (219 points) ran about 60% above the recent 5-day average — real movement is outrunning what options are pricing. Two gauges tell a consistent, nuanced story: intraday swings have run about 26% below what option prices imply, while the day’s actual range has been larger than options priced in (“under-priced”). Together this says today’s range expansion came from a move like the afternoon markup, not many small intraday swings — the energy for a genuinely violent intraday breakout hasn’t been spent yet. Standard levels should behave reliably here; a slightly tighter stop and target than usual is appropriate.
Price is now sitting at the ceiling of its own six-day trading range (24115-24335). Immediately overhead, within about 5 to 25 points, sits an unfilled prior high-volume price level from over a week ago, plus a level the options market itself flags as a spot where its own hedging flows could either cap or accelerate a move — that confluence, not any single number, is the real battleground above. Below, the single-print shelf near 24200 and a rejection zone from today’s own low near 24115-24140 are the first lines of support.
The historical read offers little conviction either way: across the most relevant statistical comparisons only one leans bullish and none carry a meaningful edge — the closest match (low-volatility Double-Distribution days opening inside range) split 44% up, 44% down over nine prior instances, essentially a coin flip, though it typically produces a bigger range (around 300 points) than today’s 219.
Opening Playbook
Inside today’s value (24120-24180): a rotational day — fade toward the opposite edge, no strong conviction either way. Below value but still inside today’s range (24115-24120, a very narrow band): a mild lean toward continued selling, but a rejection zone sits right there, making this a low-conviction, quick-resolving pocket. Above value but inside range (24180-24335, where today closed): the bullish read stays intact, but the overhead confluence at 24335-24360 is the first real test — a rejection there is the higher-probability outcome given the weak statistical backdrop. Gap below today’s low (under 24115.45): treat as initiative selling, but watch for a trap — a rejection zone sits almost immediately below. Gap above today’s high (over 24334.55): the overhead confluence (unfilled high-volume level plus the options market’s own flagged level) sits just 5-25 points into the gap — a fade-the-gap setup is live unless price prints real acceptance through it.
Line in the Sand & Key Levels
LINE IN THE SAND: 24335. Above it, with acceptance, the path opens toward 24390 and validates a genuine breakout of the six-day range; below it, price stays capped and today’s own value area (24120-24180) remains the gravitational center.
KEY LEVELS (high to low): 24390 | 24335-24360 (overhead confluence: unfilled level + options hedging level) | 24334.55 (today’s high/close, range ceiling) | 24200-24206 (thin shelf, first support) | 24180 (today’s value area top) | 24150 (today’s volume center) | 24120 (today’s value area floor) | 24115.45 (today’s low, range floor).
Session Learning Note
The lesson today reinforces an old one: value and price can disagree, and when they do, it’s the late-session, longer-horizon activity — not the day’s value area — that usually wins the headline. A narrow, indecisive opening hour is not a verdict; it’s often just the base for the real move.