Friday posed a simple question: was the morning’s break above the opening hour’s range the start of real buying, or just a flash of confidence before sellers took the wheel back? By the close, the tape had answered — and not in the bulls’ favor.
EXECUTIVE SUMMARY
- NIFTY is three weeks into a one-sided weekly decline, and every major trend gauge — the moving-average stack, the volume-weighted trend stack, and the composite market score — points the same bearish way.
- Today’s early break above the opening range fully round-tripped by the close, leaving a long-liquidation-shaped session that finished at the day’s low for the second session in a row.
- Tomorrow’s line in the sand is 23,960 — today’s value ceiling and the floor of the failed rally: reclaim it and the setback looks exhausted, hold below it and the path stays open toward the low-23,800s.
MACRO CONTEXT
Three straight weeks of lower lows have kept the weekly trend pointed firmly down, and the composite market read — blending the volume-weighted trend, the moving-average trend, and market breadth — sits at a strongly bearish score, reinforced this week by a bearish crossover in the medium- and long-term daily averages. Price still trades inside the much wider multi-year band that has contained it since mid-2024. Yesterday ran squarely with the trend — a clean trend day down closing at its exact low — and today, quieter on the surface, ultimately confirmed rather than reversed that character.
The Rally That Didn’t Hold
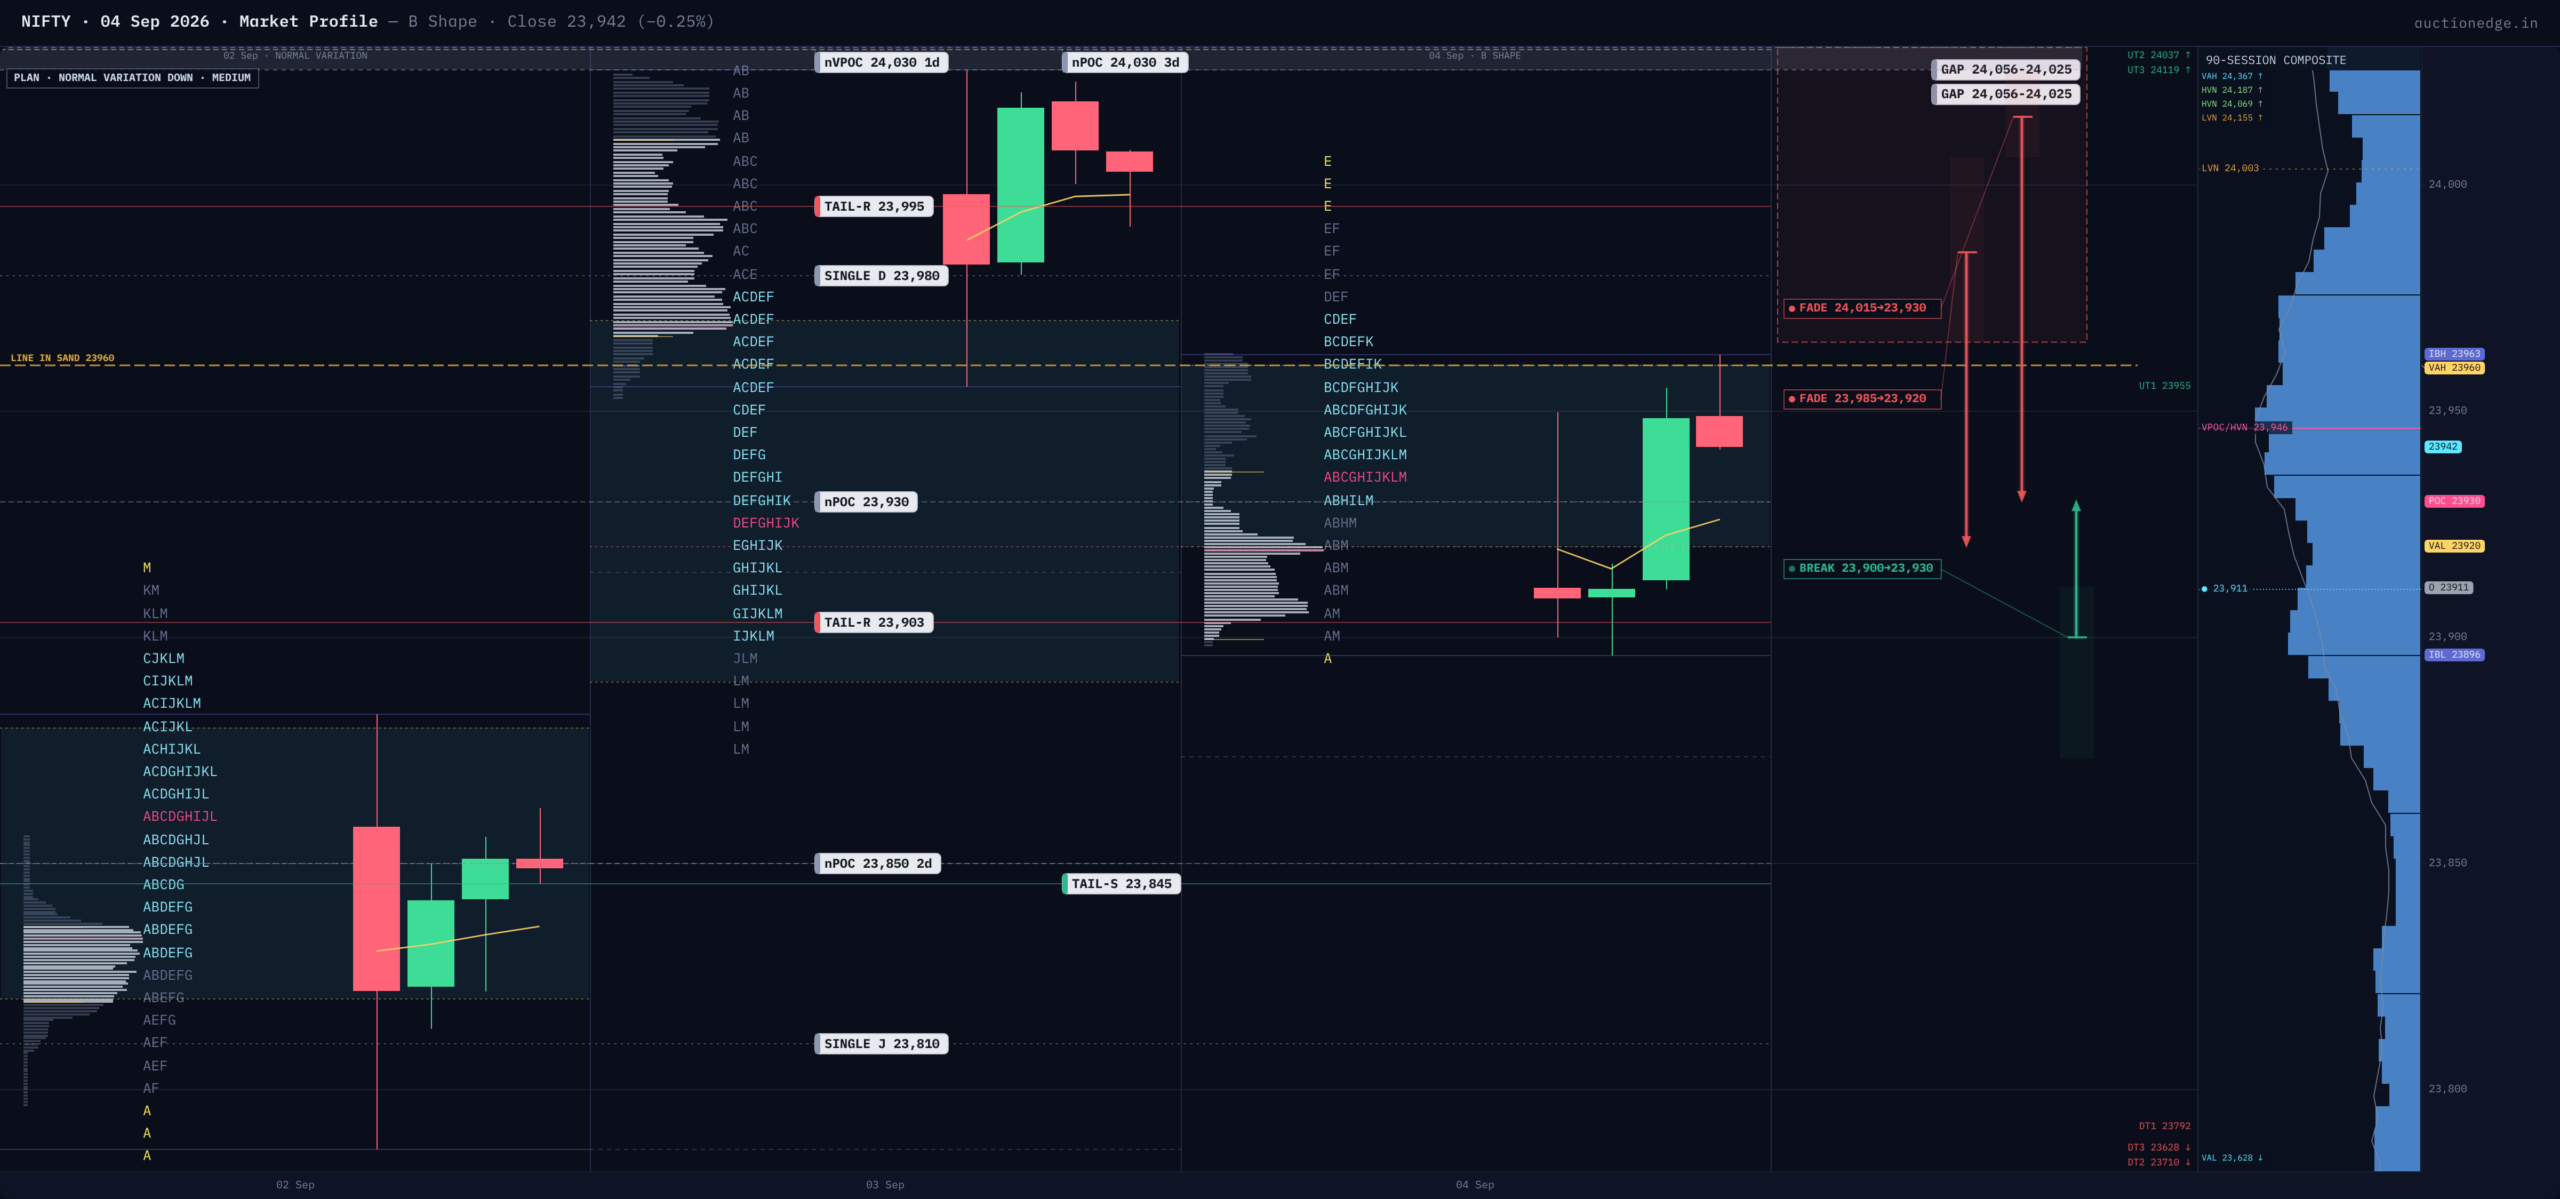
Today opened inside yesterday’s range with no fresh conviction either way — an unremarkable start suggesting sentiment hadn’t shifted overnight. Within the first ninety minutes, though, buyers pushed above the Initial Balance (the first hour’s trading range) and kept pressing, printing the session high near 24,006 in the third half-hour — early enough to look like real conviction. It didn’t hold: from late morning on, each period gave back ground instead of building on it, and by the close the entire advance had been erased. Price finished at 23,898, closing barely above the session low, in the bottom 2% of the day’s range — the shape of a long-liquidation session, a swift move that lacked the new buying to sustain itself rather than a genuine change in control. Today’s value area (the zone holding roughly 70% of the session’s trade), 23,920–23,960, sat entirely inside yesterday’s wider one, so no fresh ground was won on net. A sharper signal sits underneath that: today’s volume-weighted fairest price finished nearly 130 points above the time-based one (near 24,060 versus 23,930), while the close sat below both — real size traded up near 24,060 even as the tape spent more time camped near 23,930, leaving a pocket of trapped buying overhead whose forced selling, if revisited, can fuel further weakness. Neither today’s high nor low left a finished rejection print — both extremes are unresolved and tend to get revisited.
Under the Hood
One cross-check: the volatility backdrop just downshifted from an elevated regime to a normal one over four sessions, today’s 110-point range ran well under yesterday’s 152 and the typical 159, options are still pricing more movement than the market has delivered, and the ratio of recent actual swings to what options pricing implies stays compressed — a coiled state that has historically resolved into an outsized move once it lets go.
Balance & Structure
Price sits almost exactly on the center of gravity of the past three sessions’ range (roughly 23,790–24,025), arguing for a market still searching for balance rather than one already resolved. One level up, the wider balance area that broke down earlier this week remains just out of reach — today’s rally reached 24,006 but fell short of its floor near 24,020, keeping the breakdown structurally intact. The nearest ceiling is a genuine confluence: today’s selling tail and yesterday’s untested high stack back-to-back across roughly 23,965–24,025, right where that broken floor also sits. The nearest floor mirrors it — today’s and yesterday’s buying tails adjoin across roughly 23,873–23,911, reinforced by a two-day-old untested point of control at 23,850, with a fuller shelf near 23,787–23,858 one step further down.
Historical Odds
History offers no strong lean here. Of the seven most relevant comparisons, two tilt mildly bullish and none bearish, but the best of them — today’s exact combination opening inside the prior range — has favored an up day only 55% of the time across twenty instances, and every other comparison sits within a few points of a coin flip. Call it a slight lean, not a signal to act on alone.
Opening Playbook
If tomorrow opens inside today’s value (23,920–23,960): expect another rotational session — fade the edges back toward 23,930. If it opens just below value but inside range (23,896–23,920): watch for a bounce toward 23,930, since the 23,873–23,911 floor confluence sits right underneath. If it opens just above value but inside range (23,960–24,006): this reopens today’s failed rally — fade it back toward 23,920–23,930 unless it clears the full 23,965–24,025 cluster with real follow-through. If it gaps below today’s low: Trap Warning — a reflexive short runs straight into the stacked floor near 23,787–23,911, so trust downside continuation only if 23,787 gives way with volume; otherwise favor a bounce toward 23,930. If it gaps above today’s high: Trap Warning — that strength runs immediately into yesterday’s untested high and the broken balance’s floor, with another shelf waiting near 24,109–24,143, so treat it as fadeable toward 23,930 rather than a breakout worth chasing.
Line in the Sand & Key Levels
Line in the sand: 23,960. Above it, today’s failed rally gets a second look and the bias turns neutral-to-constructive; below it, sellers keep the last word and the low-23,800s stay in play.
Key levels, high to low: 24,109–24,143 (next ceiling shelf) · 24,006–24,025 (broken balance floor / yesterday’s untested high) · 23,965–24,006 (today’s selling tail) · 23,960 (value ceiling / line in the sand) · 23,930 (today’s fairest price, also a fresh untested point of control) · 23,920 (value floor) · 23,873–23,911 (floor confluence) · 23,850 (two-day untested point of control) · 23,787–23,858.
What Today Taught Us
An early break of the opening range isn’t proof of conviction by itself — it only matters if the periods behind it keep building on it. Today’s break came early enough to look like real buying, but nothing followed through, and the move round-tripped by the close. Judge a breakout by what happens after it, not by how early it happens.