The question into today’s close was whether the gap-up open could turn the IB breakout into continuation of last week’s strong finish — the afternoon fade answered it, as sellers took back everything the early buyers had won.
EXECUTIVE SUMMARY
- Last week closed bullish (81% close pct, near highs at 24271.2), but longer-term stays range-bound (11 down weeks vs 7 up), and price is back inside the 19-day balance beneath a death-cross EMA/SMA stack.
- Yesterday was a B-Shape long-liquidation day off a -2.0% gap down, settling at session lows (18% of range) with a poor high at 24300 — sellers won the day-timeframe battle.
- Today’s OTD_UP gap drove the IB breakout to 24134.7 but was rejected by a fresh selling tail stacked under unfilled gap supply, fading back to close below the open; the line in the sand is 23990.
MACRO CONTEXT
Last week closed strong at 81.23% of its range near the highs (24271.2), a bullish signature. But the longer sample shows 11 down weeks against 7 up (longterm_va_trend RANGE), so that strength sits inside a broader bracket, not a confirmed trend. Price at 23981.9 remains inside the active 19-day multi-week balance and below the death-cross-flagged EMA/SMA stack (context_bias LEAN_BEAR) — alignment is mixed-to-defensive beneath a neutral weekly picture. Yesterday’s B-Shape session already traded against that bullish close, and today’s failed gap-up extension continued giving the strength back.
Day Type, Value Area & Other Timeframe
Today opened with a 131-point (0.55%) gap up — Open-Test-Drive Up — and drove through the Initial Balance (23925.7-24076.8) to a high of 24134.7, briefly suggesting last week’s buyers were back. But the extension found no new business: it ran straight into a fresh selling tail at 24045-24135 (89.65 TPO-points) stacked beneath the still-unfilled portion of yesterday’s gap-down zone (24135-24349) — textbook overhead confluence, exactly the trap a gap-up open can walk into. Sellers rejected the push, and price round-tripped the full 209-point range to close at 23981.9, below the open, at 26.89% of range — lower-mid, seller-leaning. Value told a more nuanced story: the POC migrated a genuine 160 points higher day over day (TPO 23880->24040; Volume 23900->24000), confirming real intraday acceptance higher, yet today’s entire value area (23990-24080) nested fully inside yesterday’s wider one (23800-24210) — an INSIDE_DAY arguing for continued balance, not breakout. Net effect: initiative buyers pressed value higher but couldn’t hold it into the bell, and responsive sellers took the day-timeframe decision by the close.
Volatility Regime
Two metrics agree rather than diverge: the rubber band is EXPANDED (1.34x IV-implied), and IV (11.7) sits well under 5-day realized vol (16.4, UNDER-PRICED) — both say options are underpricing real movement, even though today’s 0.44-sigma move and 0.88x range-contraction vs the 5-day average kept the session inside normal MP tolerances (multiplier 1.0x).
Balance Area Context
Price sits INSIDE the active 19-day balance (VAH 24216/VAL 23944/VPOC 24050, composite 79.18), only 33% up from its low. More actionable: the short-term 2-day balance from Jul6-7 (24287-24530) is freshly BROKEN_DOWN, with extension targets 2X 23799.5 / 3X 23555.7 lining up with yesterday’s buying-tail zone (23805-23883).
Structural Zones
Above, first resistance is today’s selling tail at 24045-24135, backed by the unfilled 24135-24349 gap-supply zone — the confluence that turned today’s rally back. Below, a buying tail sits right under the market at 23926-24026 (6 points away), with yesterday’s buying tail at 23805-23883 and the naked 23900/23880 POCs as next magnets. Naked POCs also cluster overhead at 24000 and 24040 — today’s own unfinished business.
Historical Statistics (Relevance-Scored)
The picture is a coin-flip: confluence is only a “directional_lean” (max edge 0.4, avg 0.25), 4 of 7 stats bullish against 2 bearish. The most specific read — NORMAL_VARIATION + OTD_UP (n=47) — favors sellers, 53% down vs 36% up, avg -0.24%; the broader analog matching today’s full regime (n=21) is even more lopsided at 67% down. The generic gap-up stat (n=452, 52% up, edge 0.4) is the strongest single number but least specific to today. Net: no decisive edge, with a slight lean toward downside from the more specific combos.
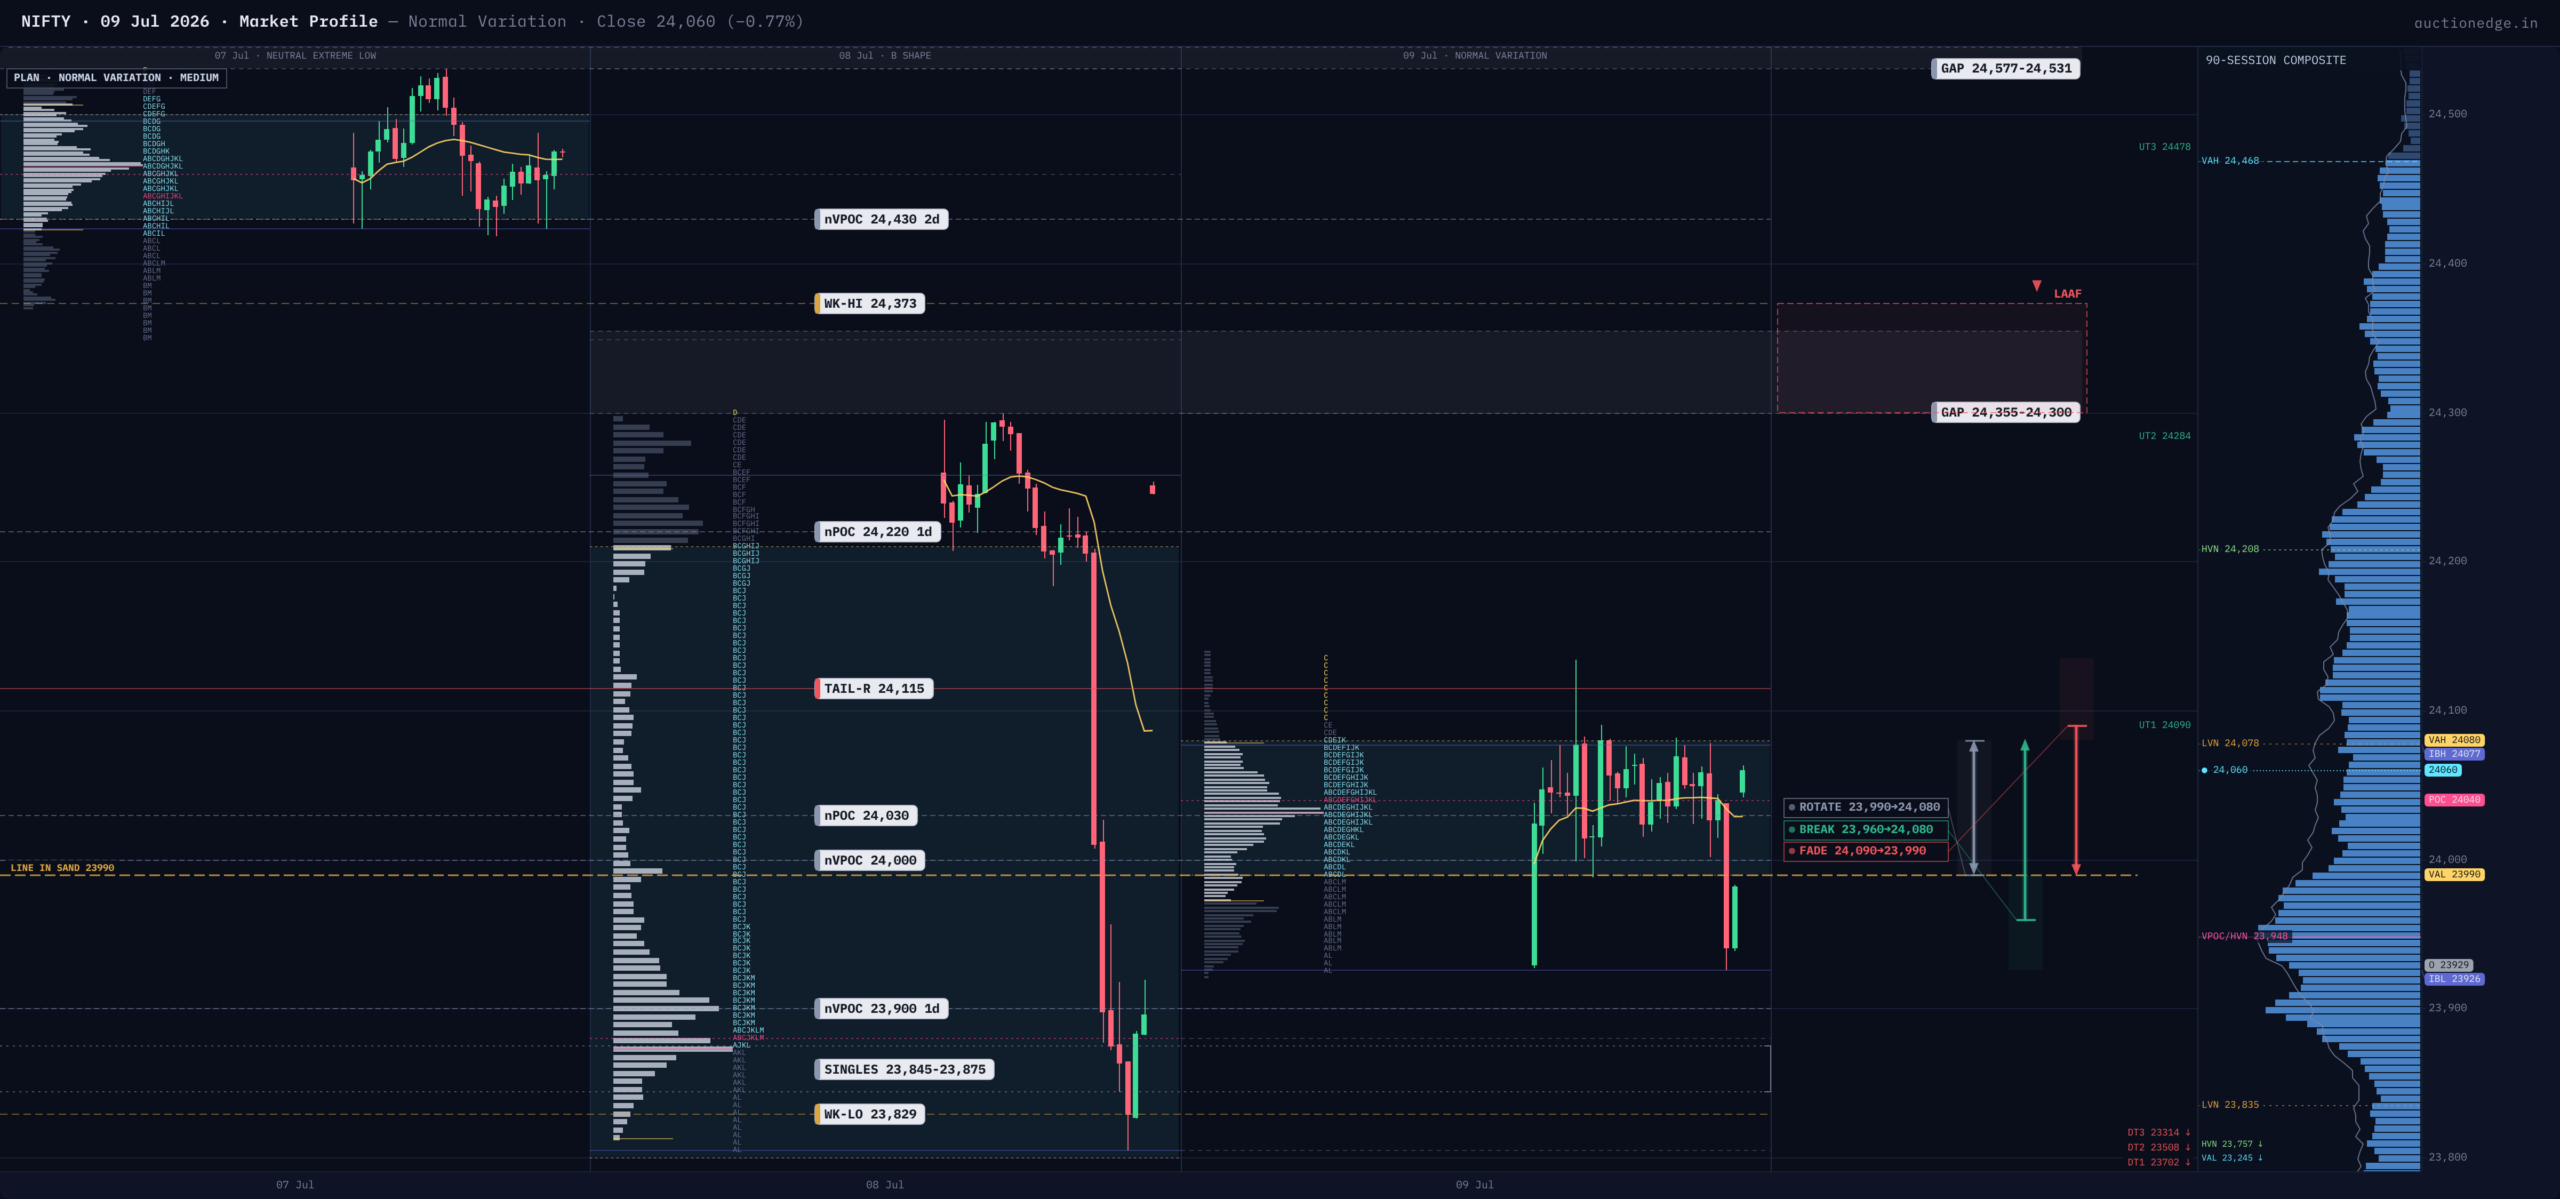
Opening Playbook
a) INSIDE VALUE (23990-24080): Between the buying tail below (23926-24026) and selling tail above (24045-24135) — expect responsive rotation fading both edges.
b) OUTSIDE VALUE, INSIDE RANGE — Below (23925.7-23990): Sits on the buying-tail zone, first real support; a hold favors reclaiming 23990/24000. Above (24080-24134.7): Runs into the 24045-24135 selling tail that already rejected today’s rally — better faded than chased.
c) BELOW RANGE (< 23925.7): Loses the IB low and buying-tail floor together, opening the naked 23900/23880 POCs and the 23799.5 balance-break target, confluent with yesterday’s 23805-23883 buying tail. Stop above 23926 on reclaim.
d) ABOVE RANGE (> 24134.7): TRAP WARNING — runs directly into the unfilled 24135-24349 gap-supply zone, the same confluence that rejected today’s rally. Fade only above balance VAH 24216; invalidate on acceptance (2+ prints) inside the gap.
Line in the Sand & Key Levels
LINE IN THE SAND: 23990. Above, buyers have reclaimed value and can press toward 24080 VAH then the 24045-24135 selling tail; below — especially on a break of the 23925.7 IB low/day low — sellers regain control and the 23900/23880 naked POCs, then 23799.5, come into play.
KEY LEVELS (high to low):
– 24349 | Gap Top (unfilled) | Outer edge of yesterday’s unfilled gap supply
– 24216 | Balance VAH | Active 19-day balance ceiling
– 24135 | Selling Tail / Gap Bottom | Today’s rejection zone
– 24080 | TPO VAH | Today’s value ceiling
– 24040 | Naked POC (TPO) | Unfinished business
– 24000 | Naked POC (Volume) | 18pts overhead
– 23990 | TPO VAL — LINE IN THE SAND | Value floor
– 23944 | Balance VAL | Active balance floor
– 23925.7 | IB Low / Day Low | Session floor
– 23799.5 | Balance-Break 2X Target | Algorithmic downside extension
Session Learning Note
An IB breakout is a range extension needing acceptance, not yet a Trend Day. Buyers extended range on the open-test-drive up but never validated the new level with the follow-through that separates continuation from a probe that fully rotates back through the value it just left. The tell was structural: today’s own selling tail sitting right beneath yesterday’s unfilled gap supply telegraphed the ceiling before price got there. Chasing the day high was the trap — the value area and gap map had already drawn it.